[Norsk]
1-wire and radon
I live in an area known to have elevated radon levels, so I wanted to have a way to keep an eye on the indoor air quality. The ordinary way to detect radon levels is to buy a special film or an electronic instrument, but I found nothing giving me detailed logs. So I decided to build something myself. Logging will make it easier to interpret the data and to see the effects from changed ventilation patterns, weather, or from any actions taken.
Aware Electronics sell simple Geiger-Müller counters that are said to be reliable. These models can be connected to the serial port of a computer. I ordered the RM-70 model, which is relatively sensitive to alpha radiation. Radon decomposes into materials emitting alpha radiation.
The RM-70 arrived in the mail along with a serial cable and an MS-DOS program. The first challenge was to get it to work using a USB port on a Linux computer. Somebody had already written a Linux program, but it didn't work properly using a USB to serial adapter, and not at all running on an ARM-based computer, which I was planning to use. Some changes in the program fixed both issues. My changes are available here. These changes should make it easier to compile the program for other operating systems as well.
|
Now I could log the way I wanted, but it would be better if I could connect the counter to a 1-wire bus, which I already have available in several rooms. Besides, 1-wire allows any number of counters to be monitored through just a single USB or serial port, and the cable length can be several hundred metres, if needed. 1-wire can be controlled by low cost devices (I use a Linksys NSLU2 running Linux), and this eliminates the need of a big, power hungry PC. RM-70 (and other models) have a RJ11 connector, which makes use of three wires: ground, power and signal. I tried to power it using currents from 5V to 12V, and all seemed to work. The signal wire seems to follow the input current, and a "click" causes it to drop to 0V for a short while. The Aware website states that this period is about 80 µs.
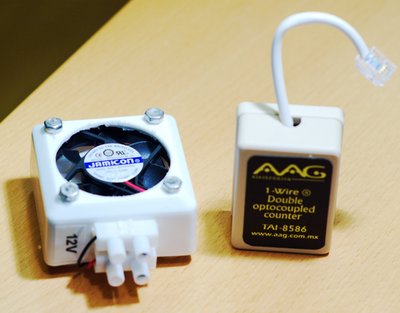
This seemed to be a good fit for the DS2423 1-wire counter device, and it turned out that the RM-70 needs so little power that it can get it from the 1-wire bus, which simplifies the wiring. I used a TAI-8586 from AAG Electronica (other DS2423 based counters, such as rain gauge kits, may also be used) and I connected the RM-70 directly to the DS2423 on the TAI-8586 board this way:
| DS2423 | RM-70 |
| ground (pin 1) | ground (wire 4) |
| Vbat (pin 3) | Vcc (wire 3) |
| input B (pin 5) | signal (wire 2) |
The wires for the RM-70 refer to the RJ11 connector's pins from the left to the right with the clip downwards and the cable towards you. Vbat is 5V and a "click" becomes a drop from 5V to 0V. DS2423 counts every falling edge, meaning that the dead time in the RM-70 and in the DS2423 will overlap. The DS2423 has a typical dead time of 290 µs (at most 460 µs) and it's therefore the slowest of the two. However, it wont saturate until the radiation reaches several thousand clicks per second. This would be a very high radiation level, and for my use the DS2423 will suffice by a large margin. The picture to the right shows how I connected the cable for the RM-70 to the TAI-8586. The board has several available holes that may be used, so there is no need to solder directly on the pins of the DS2423 (which is mounted on the other side of the board).
|
| 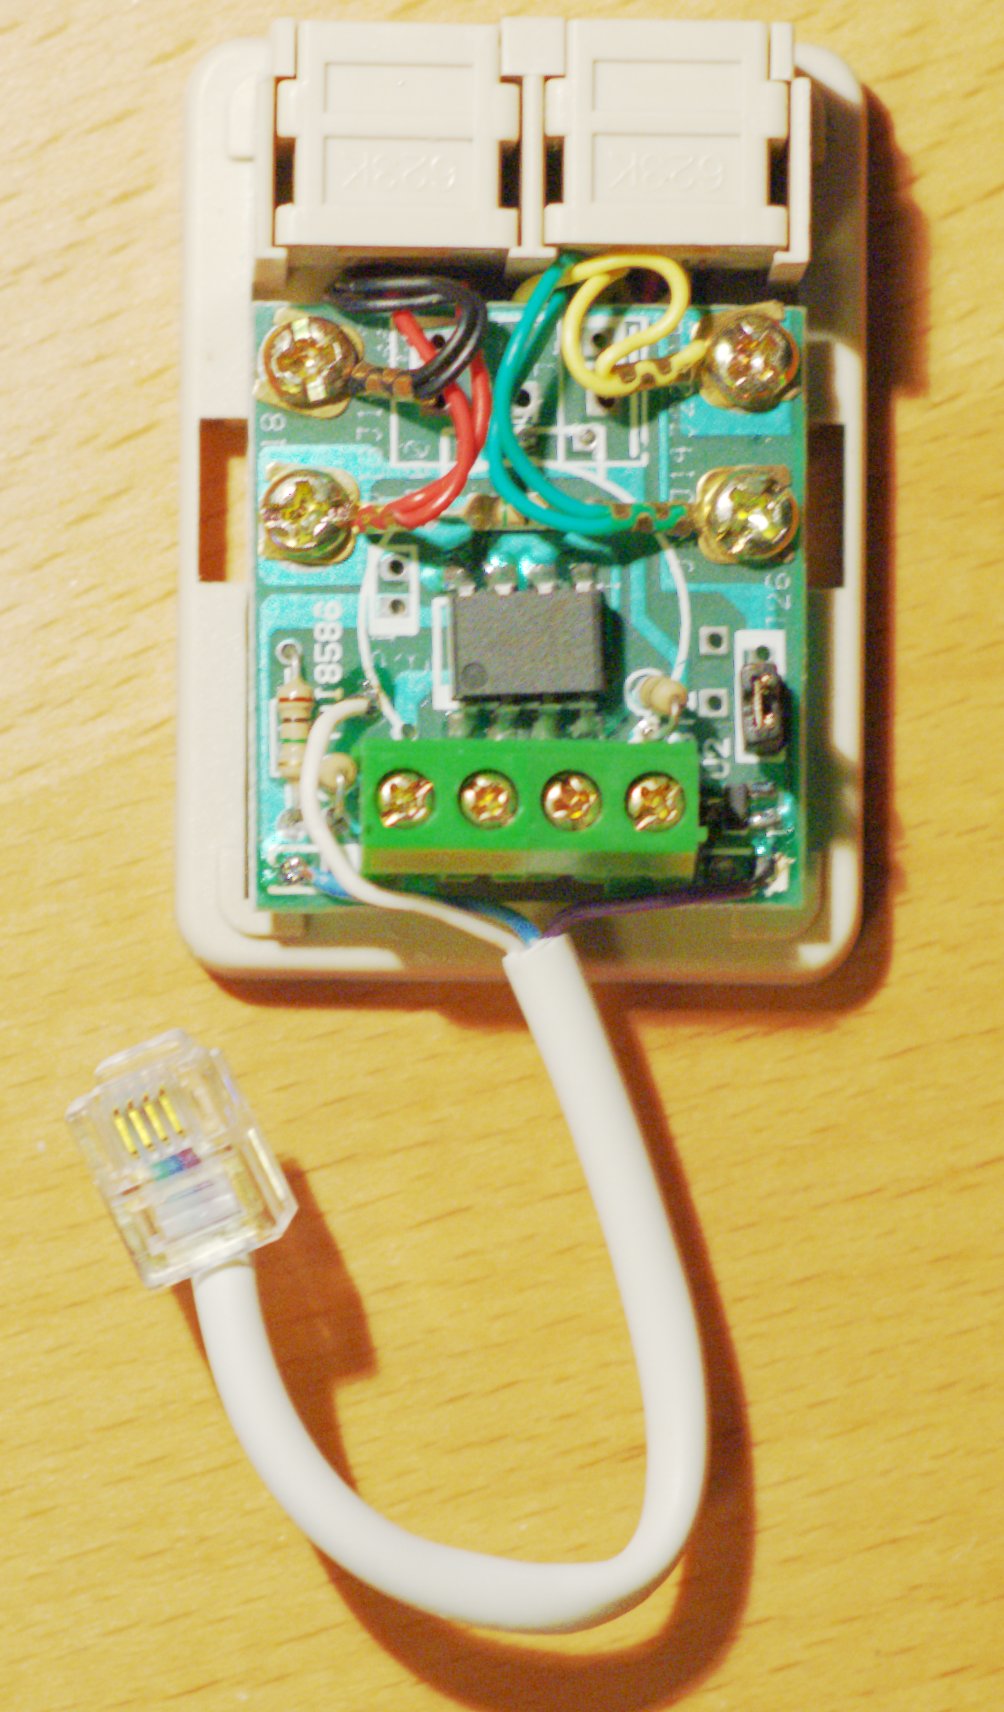
White is earth, purple is 5V and blue is the signal (click to enlarge).
|
|
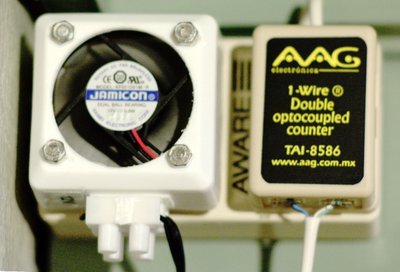
A filter is located about 1 cm under the fan. The enclosure has a leg at each corner, which makes a spacing that allows air to flow in. I also included a small resistor to reduce the fan speed and thereby making the fan nearly noiseless.
|
|
I made a fan to increase the counter's sensitivity to radon, or more precisely to the radon products that stick to dust, and I put it in front of the sensor window of the RM-70. Aware Electronics sell such fans, but it's not difficult to make these oneself. The filter was made from a coffee filter. I don't think it will be necessary to change the filter often, since the half lives of the radon products are short (usually measured in minutes), so radioactive particles wont accumulate over time. The picture below shows the fan and the TAI-8586 attached to the RM-70.
|
Status 29 September 2007
An RM-70 with a fan has been mounted in the living room and is currently collecting data. I have nothing yet to compare with for calibration. Two new Geiger counters have been ordered: one RM-60 and one RM-70. The RM-60 isn't as sensitive to alpha radiation, but almost equally sensitive to gamma radiation. I'm planning to mount it in the attic (probably radon free) so I can measure the background radiation. I plan to mount the new RM-70 in the child's room in the basement. By measuring the background radiation I can determine the increased radioactivity indoors. I can probably assume that the increase has been caused by radon.
Update 6 October 2007
|
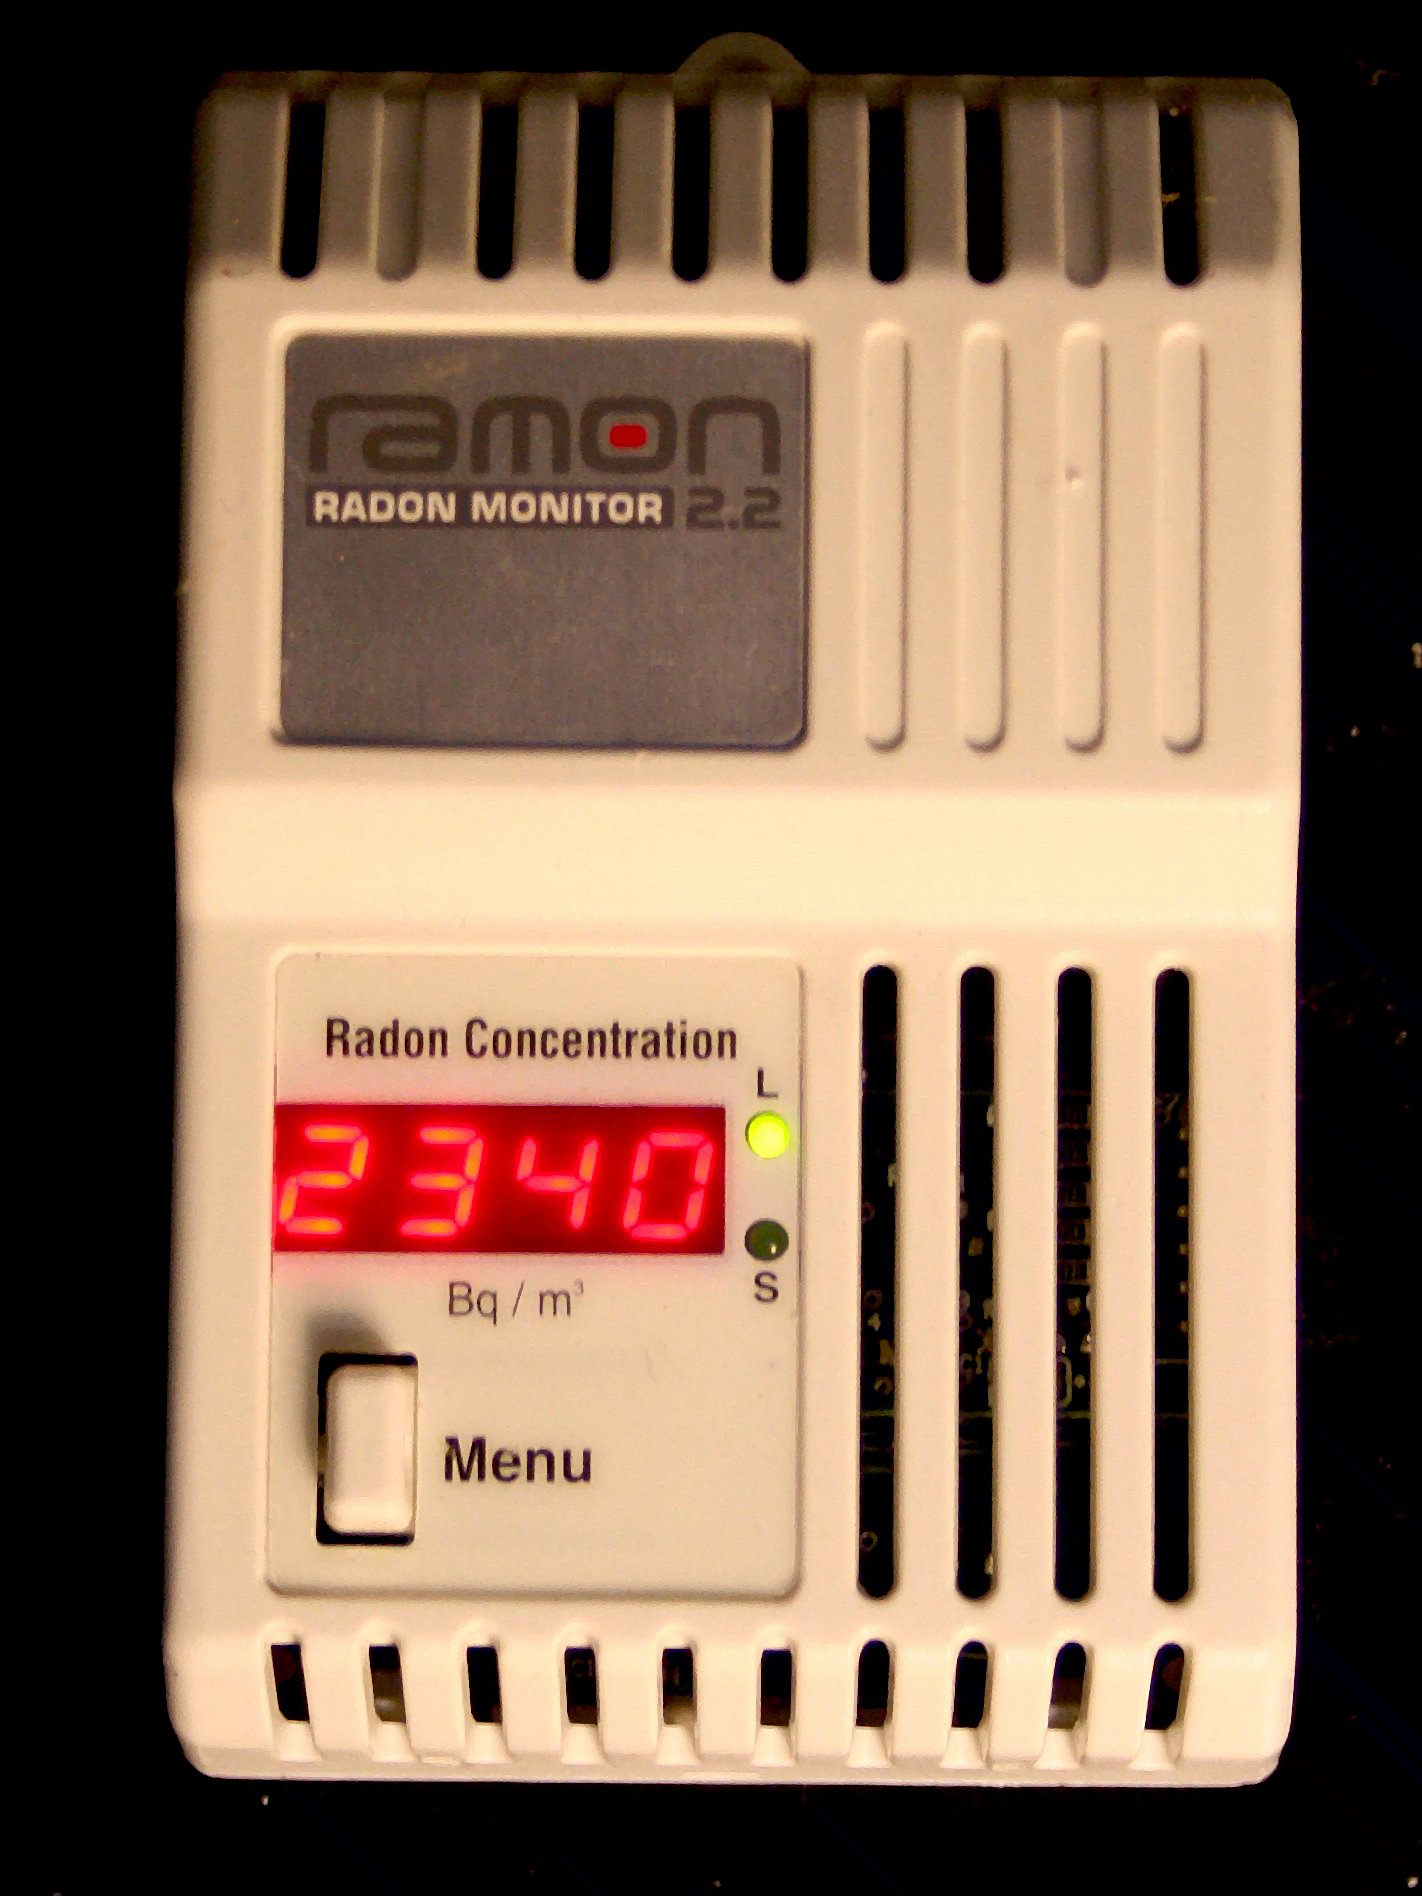
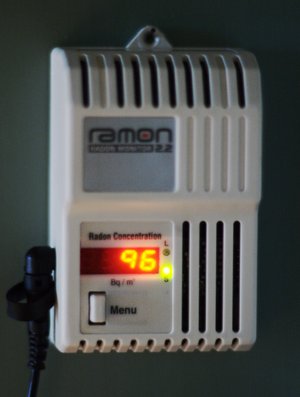
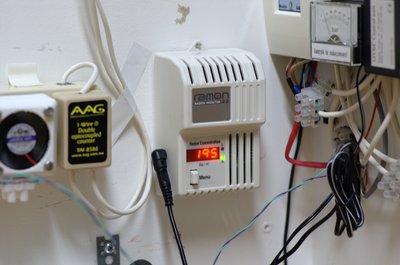
I bought a Ramon 2.2 electronic radon sensor in order to be able to calibrate my own sensors. It displays the radon level as a moving 1 week average, and it also gives preliminary readings after two days. I put it close to my own sensor in the living room, and when the two days had passed, it was reading 96 Bq/m³. My own sensor had been counting 36.8 clicks per minute as an average in the same period. However, before I can begin to compare the readings, I need to know how many clicks the background radiation accounts for. The two new geiger counters which I had ordered, have now cleared customs and I should have them in a couple of days.
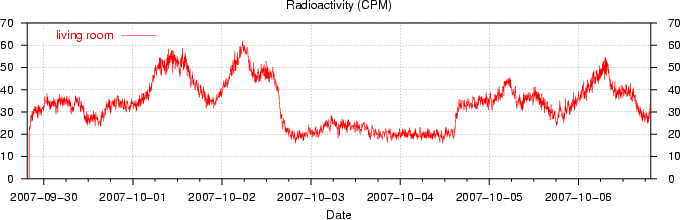
My sensor in the living room has been logging for a week. The results are shown in the graph below. It looks like the radiation peaks in the morning and is at its lowest in the evening. I don't know yet if this is a regular pattern or what may cause it. For two days, between 2 and 4 October, the fan was switched off, and the graph clearly shows that the fan greatly increases the sensitivity.
|
|
Update 17 October 2007
Two new sensors, one RM-60 and one RM-70, have been logging for over a week. I now have three sensors running on the same 1-wire bus parasitically. The two new ones were placed in the attic, where I don't expect any significant alpha or beta radiation. The RM-60 will remain there permanently and measure the background radiation which will also affect the sensors elsewhere. When this gets subtracted from the other readings, I should get reasonably good readings of the alpha radiation contribution, which is what I need in order to determine radon presence. The new RM-70 was logging next to the RM-60 for a week so I could get sufficient data to correlate their difference in senstivity. I also discovered that the reported radiation level would vary slightly (10-15%) depending on the orientation of the sensors; they reported higher radiation when they were facing upwards. All sensors should therefore be oriented the same way, unless the readings are corrected for this.
The Ramon 2.2 device has been reporting radon levels in the living room for almost two weeks. The weekly means have ranged from 79 to 100 Bq/m³. It probably detects fairly large variations within a few hours. The weekly mean can change 4 to 5 Bq/m³ in about the same number of hours. If we assume that Ramon 2.2 displays an average of 168 (7×24) hourly values, such rapid changes must mean that the values entering and leaving the one week window differ a lot. For instance, if one hour has a 200 Bq/m³ average while the same hour one week previously had 30 Bq/m³, this would be enough to raise the weekly mean from 90.0 to 91.0 Bq/m³ in just one hour. These large differences might be the same variations that I've seen using my own sensor. At first the variations seemed to be occurring at the same hours every day, but this link has seemed less clear more recently. Maybe it is changes in the weather that influence the radon levels.
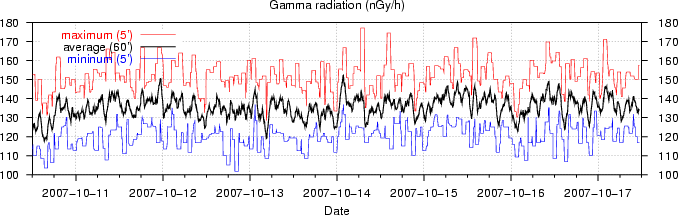
The graph below shows the gamma radiation measured in the attic over the past week. When I subtract this from readings elsewhere in the house, I should be able to isolate the radiation caused by radon. Based on the RM-60 datasheet, I've assumed that one click per minute from gamma radiation (137Cs) equals 0.95 µR/h = 8,84 nGy/h.
Update 22 October 2007
Two RM-70's have been in action for more than a week in the living room and they have been logging exactly same variation. One of them seems a little more sensitive (16%) than the other.
Ramon 2.2 has also been measuring in the living room, and I now have more than two weeks of data. However, when compared with data from RM-70, there are some differences. Ramon 2.2 and RM-70 seem to agree about the trends, but the general levels drift somewhat. Perhaps the RM-70 and Ramon respond to changes in different ways. Such differences should become less obvios over time, so I'll continue the comparison in the living room for still some time.
Update 28 October 2007
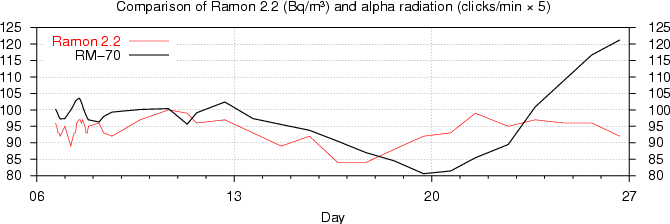
This is a comparison of Ramon 2.2 and RM-70 in the living room:
|
| 
|
Three weeks of data have given a mean of 93 Bq/m² for Ramon 2.2 and 20.23 clicks per minute for RM-70 excluding gamma radiation, which averaged 17,18 clicks per minute.
I've moved Ramon 2.2 to the storeroom in the basement, where I expect the highest radon levels. In order to calibrate RM-70 I need to expose the sensors to different radon levels. Both RM-70 and Ramon reported significally higher levels of radiation in the storeroom. Ramon's first reports were around 200 Bq/m³.
The gamma radiation measured in the attic seems to be stable and remains the same every day, except for the two past days, which were rainy and had a 5% increase in radiation.
|
Update 14 November 2007
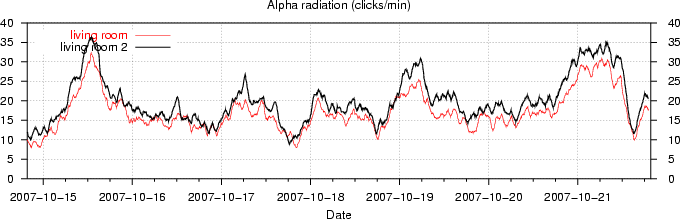
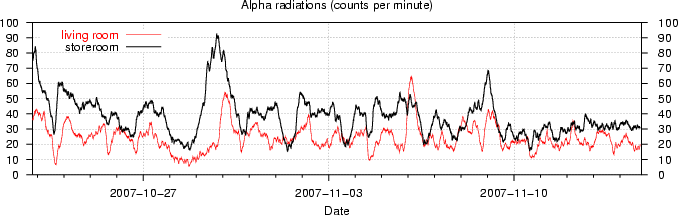
The graph below shows the alpha radation in two different rooms over a period of 23 days. Even though the sensors are located in two different floors, the levels are changing roughly the same way.
Update 2 January 2008
I now have about 10 weeks of data from the storeroom in the basement. Ramon and my own sensors show the same variations, but not in a linear fashion. However, a polynomial function seems to provide a useful translation from counts per minute to Bq/m³:
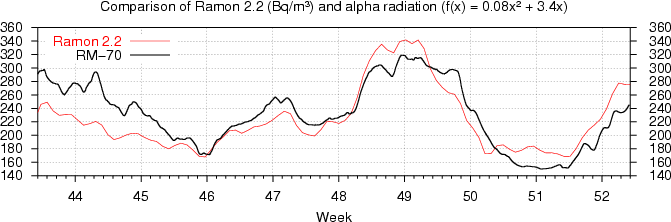
Based on the data from the storeroom and the living room I found that the following functions seem to translate fairly well from counts per minute to Bq/m³: f(x) = 0.08x² + 3.4x for the sensor in the storeroom and f(x) = 0.063x² + 3.1x for the sensor in the living room, where x is counts per minute from alpha radiation (that is, counts after gamma radiation has been subtracted). At least, the functions seem to do the job for weekly means in the 85 - 340 Bq/m³ range, which is what I've been able to measure using Ramon.
As mentioned, I have a separate sensor for logging gamma radiation, so I can subtract this in order to isolate radiation from radon. The gamma radiation turns out to be pretty constant. So far, it has only changed 10% from the lowest levels to the highest. Therefore, it wouldn't cause much loss of accuracy just to assume a constant subtraction in the translation functions. The gamma radiation is low in dry weather and up to 10% higher in rain or snow.
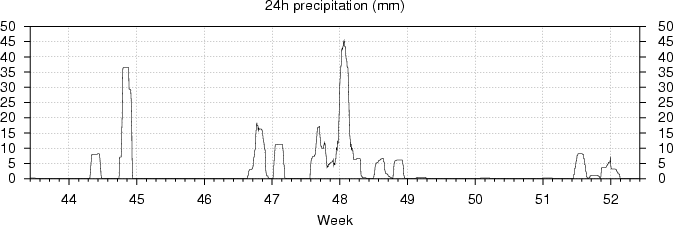
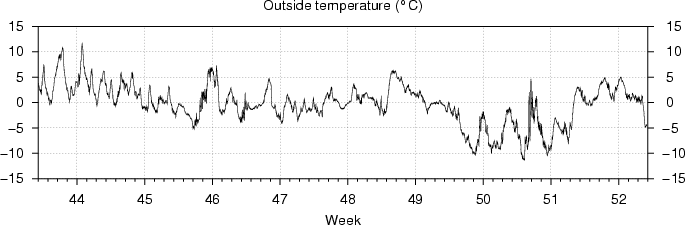
Before I began this project I had read that the radon levels were highest in cold weather, that is, during winter. Based on a few months of data, however, it seems to me that precipitation, not temperature, is the key factor. During rainfall, and possibly snowfall, the radon level increases sharply. There hasn't been any heavy snowfalls so far this winter, so I haven't been able to determine if a lot of dry snow has the same effect as heavy rain.
Below are two graphs which show the precipitation and outside temperature for the same period. Note the heavy precipitation in week 48, which resulted in a sharp increase in radon. Half of it fell as rain, the other half as snow, but most of the snow melted. The cold period around week 50 was dry and resulted in a low radon level.
Update 6 January 2008
We just had the first decent amount of dry snow this winter. Between the 5 and 6 January 20 cm of fresh, dry snow fell (20 mm water equivalent), increasing the total snow depth to 25 cm. Before the snow fell, the ground was partly free of snow, partly covered by ice, and the ground temperature was below 0 °C to depths up to 15 - 20 cm. Snow is a good insulator, so after the snowfall the ground temperature increased to +0.2 °C at the surface and to +1.7 °C 20 cm deep, but this isn't enough to cause any snow to melt.
Previously, the radon levels has increased sharply after both rain and snow, but previous snowfalls have been wet. Dry snow while there's frost in the ground does not affect the radon level. It remained unchanged at about 50 Bq/m³ in the living room and at about 150 Bq/m³ in the storeroom. 20 mm of rain or wet snow has previously briefly increased the levels to about 150 Bq/m³ in the livingroom and to somewhere around 500 Bq/m³ in the storeroom. It seems therefore that it is ground wetness that causes radon to penetrate into the basement. It means that I should expect lower radon levels in general during winter, not higher as stated elsewhere.
Update 8 January 2008
|
More snow has fallen, but this time the radon levels did increase even though the snow was dry. The sensor in the basement storeroom reached 300 Bq/m³ and the one in the living room reported more than 150 Bq/m³, both readings were about twice the readings from the day before. Even though the temperature has stayed below 0 °C, the ground frost near the house is gone and the snow near the ground has become wet. This demonstrates the insulating force of the snow cover. The year round soil temperature deep down is about 5 °C. The wet snow near the ground might have caused the soil to become wet, and this might be the reason why the sensors report more radon.
Anyway, the change in radon was definitely not caused by the low temperature, for it has changed little; it may just have become slightly warmer.
Another week of data hasn't changed the relationship between the RM-70 and Ramon; the conversion function still seems to be valid. The average of two and a half month of data is 228 Bq/m³ according to the RM-70 and 226 Bq/m³ according to Ramon. I'll now consider the RM-70's properly calibrated and I'll use Ramon to chart radon levels in other rooms.
|

|
Update 10 February 2008
Ramon 2.2 has been a few weeks in the child's room which which is next door to the storeroom, where I've detected the highest radon levels. Somewhat surprised I found the radon level in the child's room to be only a little above 50 Bq/m³, which is less than in the living room one floor above. The explanation could be the size of the rooms. And because fresh air is blown into the child's room while air is sucked out of the storeroom, radon will not easily flow into the child's room.
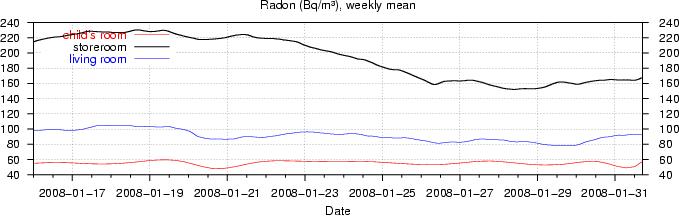
Then I switched off the ventilation system in the house in order to see how it affects radon. The effect was huge and immediate. The readings I got were so high that I had to recalibrate my sensors for such levels. I had previously found that I could multiply counts per minute by about 5 to get Bq/m³, but I got a slightly better result to use a polynomial function. This, however, doesn't work for high levels, but the 5 factor seemed to be valid also for high levels, so I went back to use a factor of 5.6 for the sensor in the storeroom and 4.8 for the sensor in the living room.
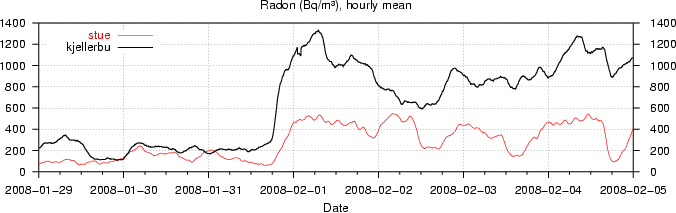
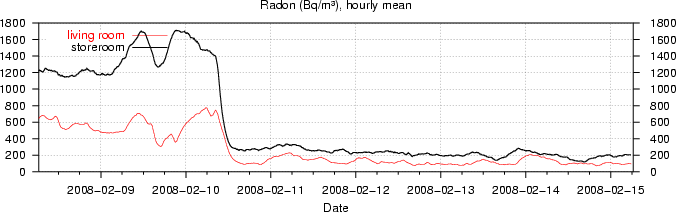
After a few hours the radon levels increased from about 50 Bq/m³ in the living room to 500 Bq/m³, from about 50 Bq/m³ to 600 Bq/m³ in the child's room and from about 250 Bq/m³ to 1200 Bq/m³ in the storeroom! The graph below shows the levels as hourly means in the living room and the storeroom in the days before and after the ventilation system was switched off.
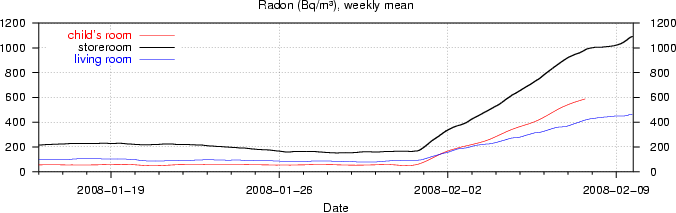
After 10 days I could plot the following weekly means:
|
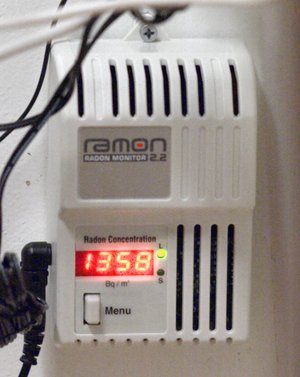
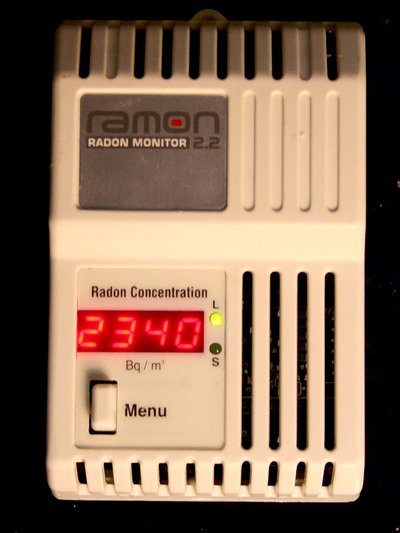
I stopped the measurements in the child's room after a week, so I could use the sensor to recalibrate. I placed Ramon 2.2 in the storeroom, and as can be seen in the picture to the right, it reported radon levels well over 1000 Bq/m³. The hourly means reported by my own sensor were between 600 Bq/m³ and 1800 Bq/m³ after recalibration.
58 mm precipitation as snow, mostly wet snow (about 50 cm), fell during this week. This may have caused more radon to penetrate into the house, but this hardly plays any significant part of the huge increase.
While the ventilation system has been off, we've ventilated manually by opening windows and doors. This has caused the radon levels to decline quickly, but as soon as the windows or doors are closed, the radon concentration rises back to its previous levels again after a few hours. Apparently, the air needs to be changed continuously in order to keep radon out. The ventilation system seems to be able to reduce radon by 75% - 90% depending on the room.
Another observation over the past weeks during which we've had plenty of snow, is that the gamma sensor in the attic has reported lower gamma radiation by a few percent. The reason might be that snow on the roof absorbs some radiation, which would demonstrate that it is possible to measure the amount of water in the snow by placing one sensor above the snow and one sensor below it and calculate the difference.
|
|
Update 15 February 2008
I switched the ventilation system back on, and the effect was pretty instant, like it was when the ventilation system was switched off. After a few hours between 80 and 90% of the radon was gone. The graph below shows the effect.
Update 20 August 2008
A lightning strike on 29 July damaged two sensors, which I was able to repair with spare parts. In order to check that the repaired sensors were functioning as they should, I switched off the ventilation system for some hours and verified that the sensors reported higher radon levels. The effect was again instant. After a few hours the levels in the living room had gone from around 50 Bq/m³ to about 200 Bq/m³ and in the storeroom from about 400 Bq/m³ to well over 3000 Bq/m³. Recent heavy rain is probably the reason why the levels were so high. I also compared with Ramon 2.2, and after a week of measuring Ramon confirmed that the levels in the living room were around 50 Bq/m³.
Update 13 January 2009
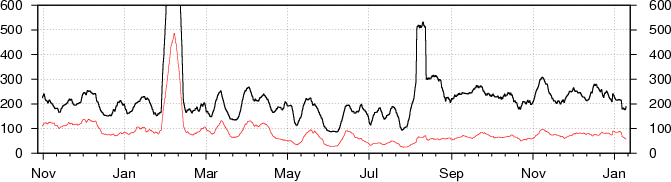
The sensors have been logging for well over a year now. The data show that the living room had a mean of 82 Bq/m³ in 2008 and the storeroom had 232 Bq/m³. Brief measurements in other rooms indicate that the storeroom is the only room with a yearly mean higher than 100 Bq/m³. The graphs below show the weekly average for a full year. The high readings in early February and briefly in August were caused by the ventilation system intentionally being switched off. Without ventilation the readings go up by a factor of 5 to 20.
Update 18 April 2011
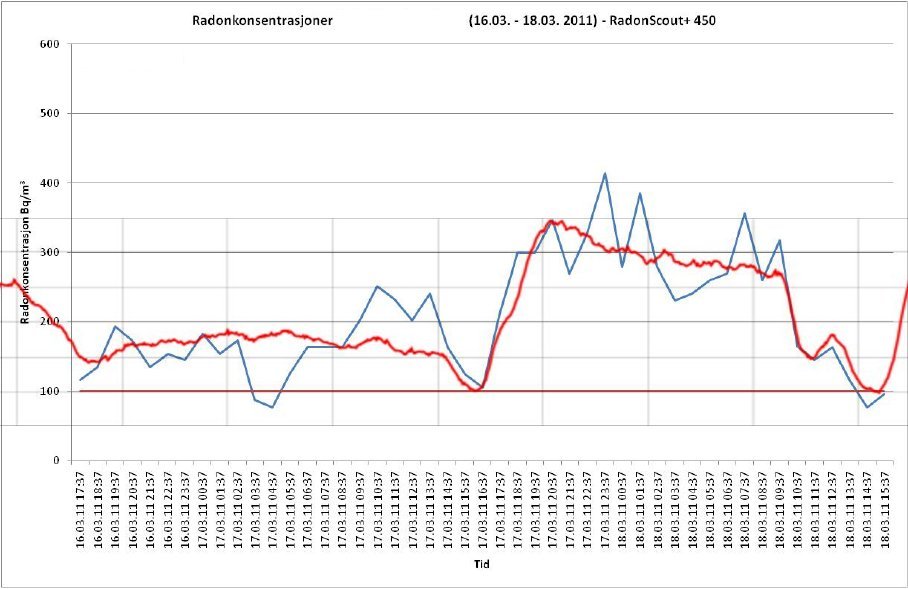
Another two years have passed and the sensors are still working. The filters have not been changed. One of the sensors was recently tested side by side with Radon Scout+, which costs 20 times as much. The results:
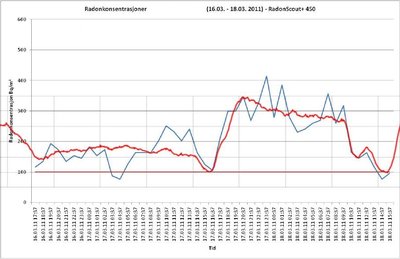
Radon Scout+ (blue line) reported an average of 206 Bq/m³. My sensor (red line) also reported 206 Bq/m³. This might be a lucky coincident, but it's still reassuring that the accuracy seems good. We can also see that the sensors generally report the same trends, but the data from my sensor appear much smoother and don't appear to pick up all the smaller fluctuations reported by Radon Scout+ (assuming that those are real changes and not noise). Perhaps the reason is that my sensor traps dust and once trapped, the radioactivity will remain for a while even if the air gets replaced. So it will respond a bit slow to actual changes. Anyway, the close similarities between Radon Scout+ and my sensor are reassuring and strongly suggest that the short time trends picked up by my sensors are real. During short tests (a few days or weeks) with Ramon 2.2 there have been differences, and I'm now inclined to think that this is due to inaccuracies in Ramon 2.2 rather than in mine. Ramon 2.2 (which I did use for calibration) seems to require several weeks of operation before the average can be fully trusted.
Update 19 April 2011
|
The highest radon levels are found in the basement storeroom, where the pipes enter and leave the house. I placed Ramon 2.2 next to the pipes for a few days. It measured well over 2000 Bq/m³, or 10 times as much as elsewhere in the room. So an attempt to seal this spot can have positive effects.
|
steinar@latinitas.org (Steinar Midtskogen)