[Norsk]
About the snow depth sensor
| |
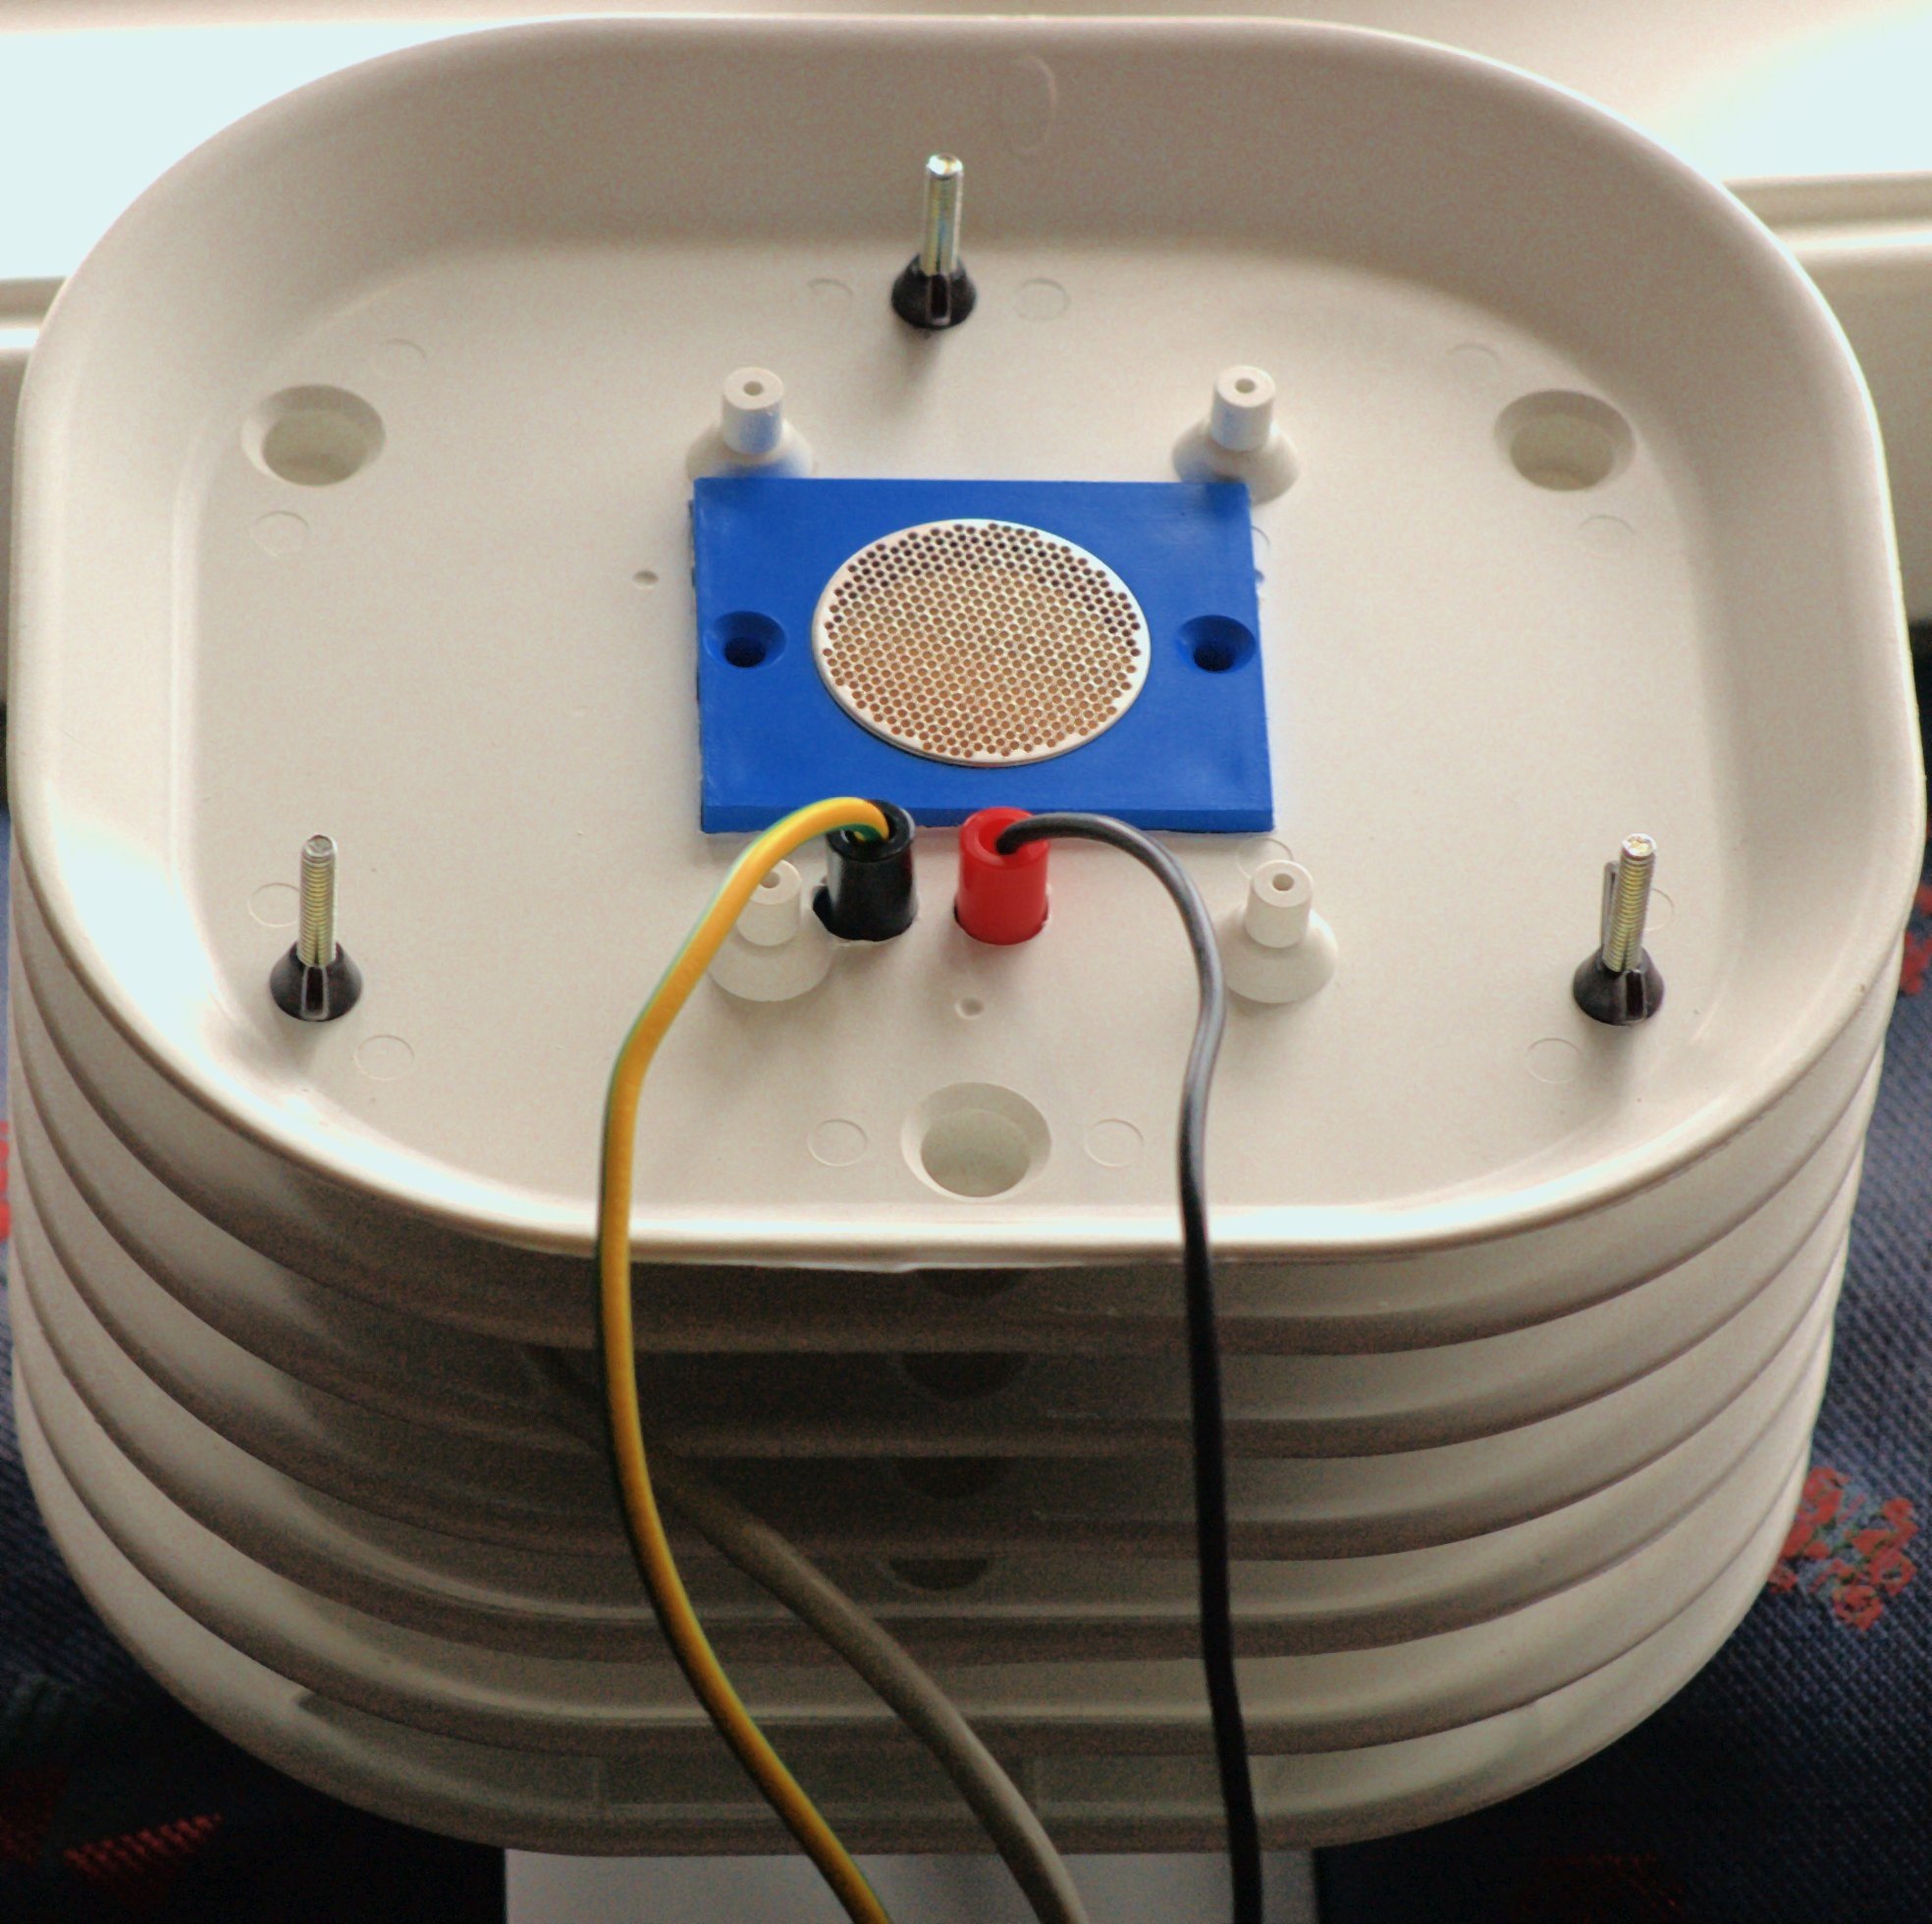
The snow depth sensor.
|
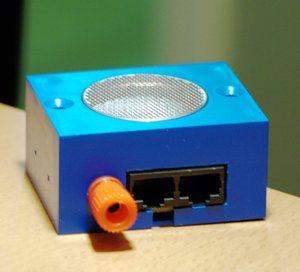
| |
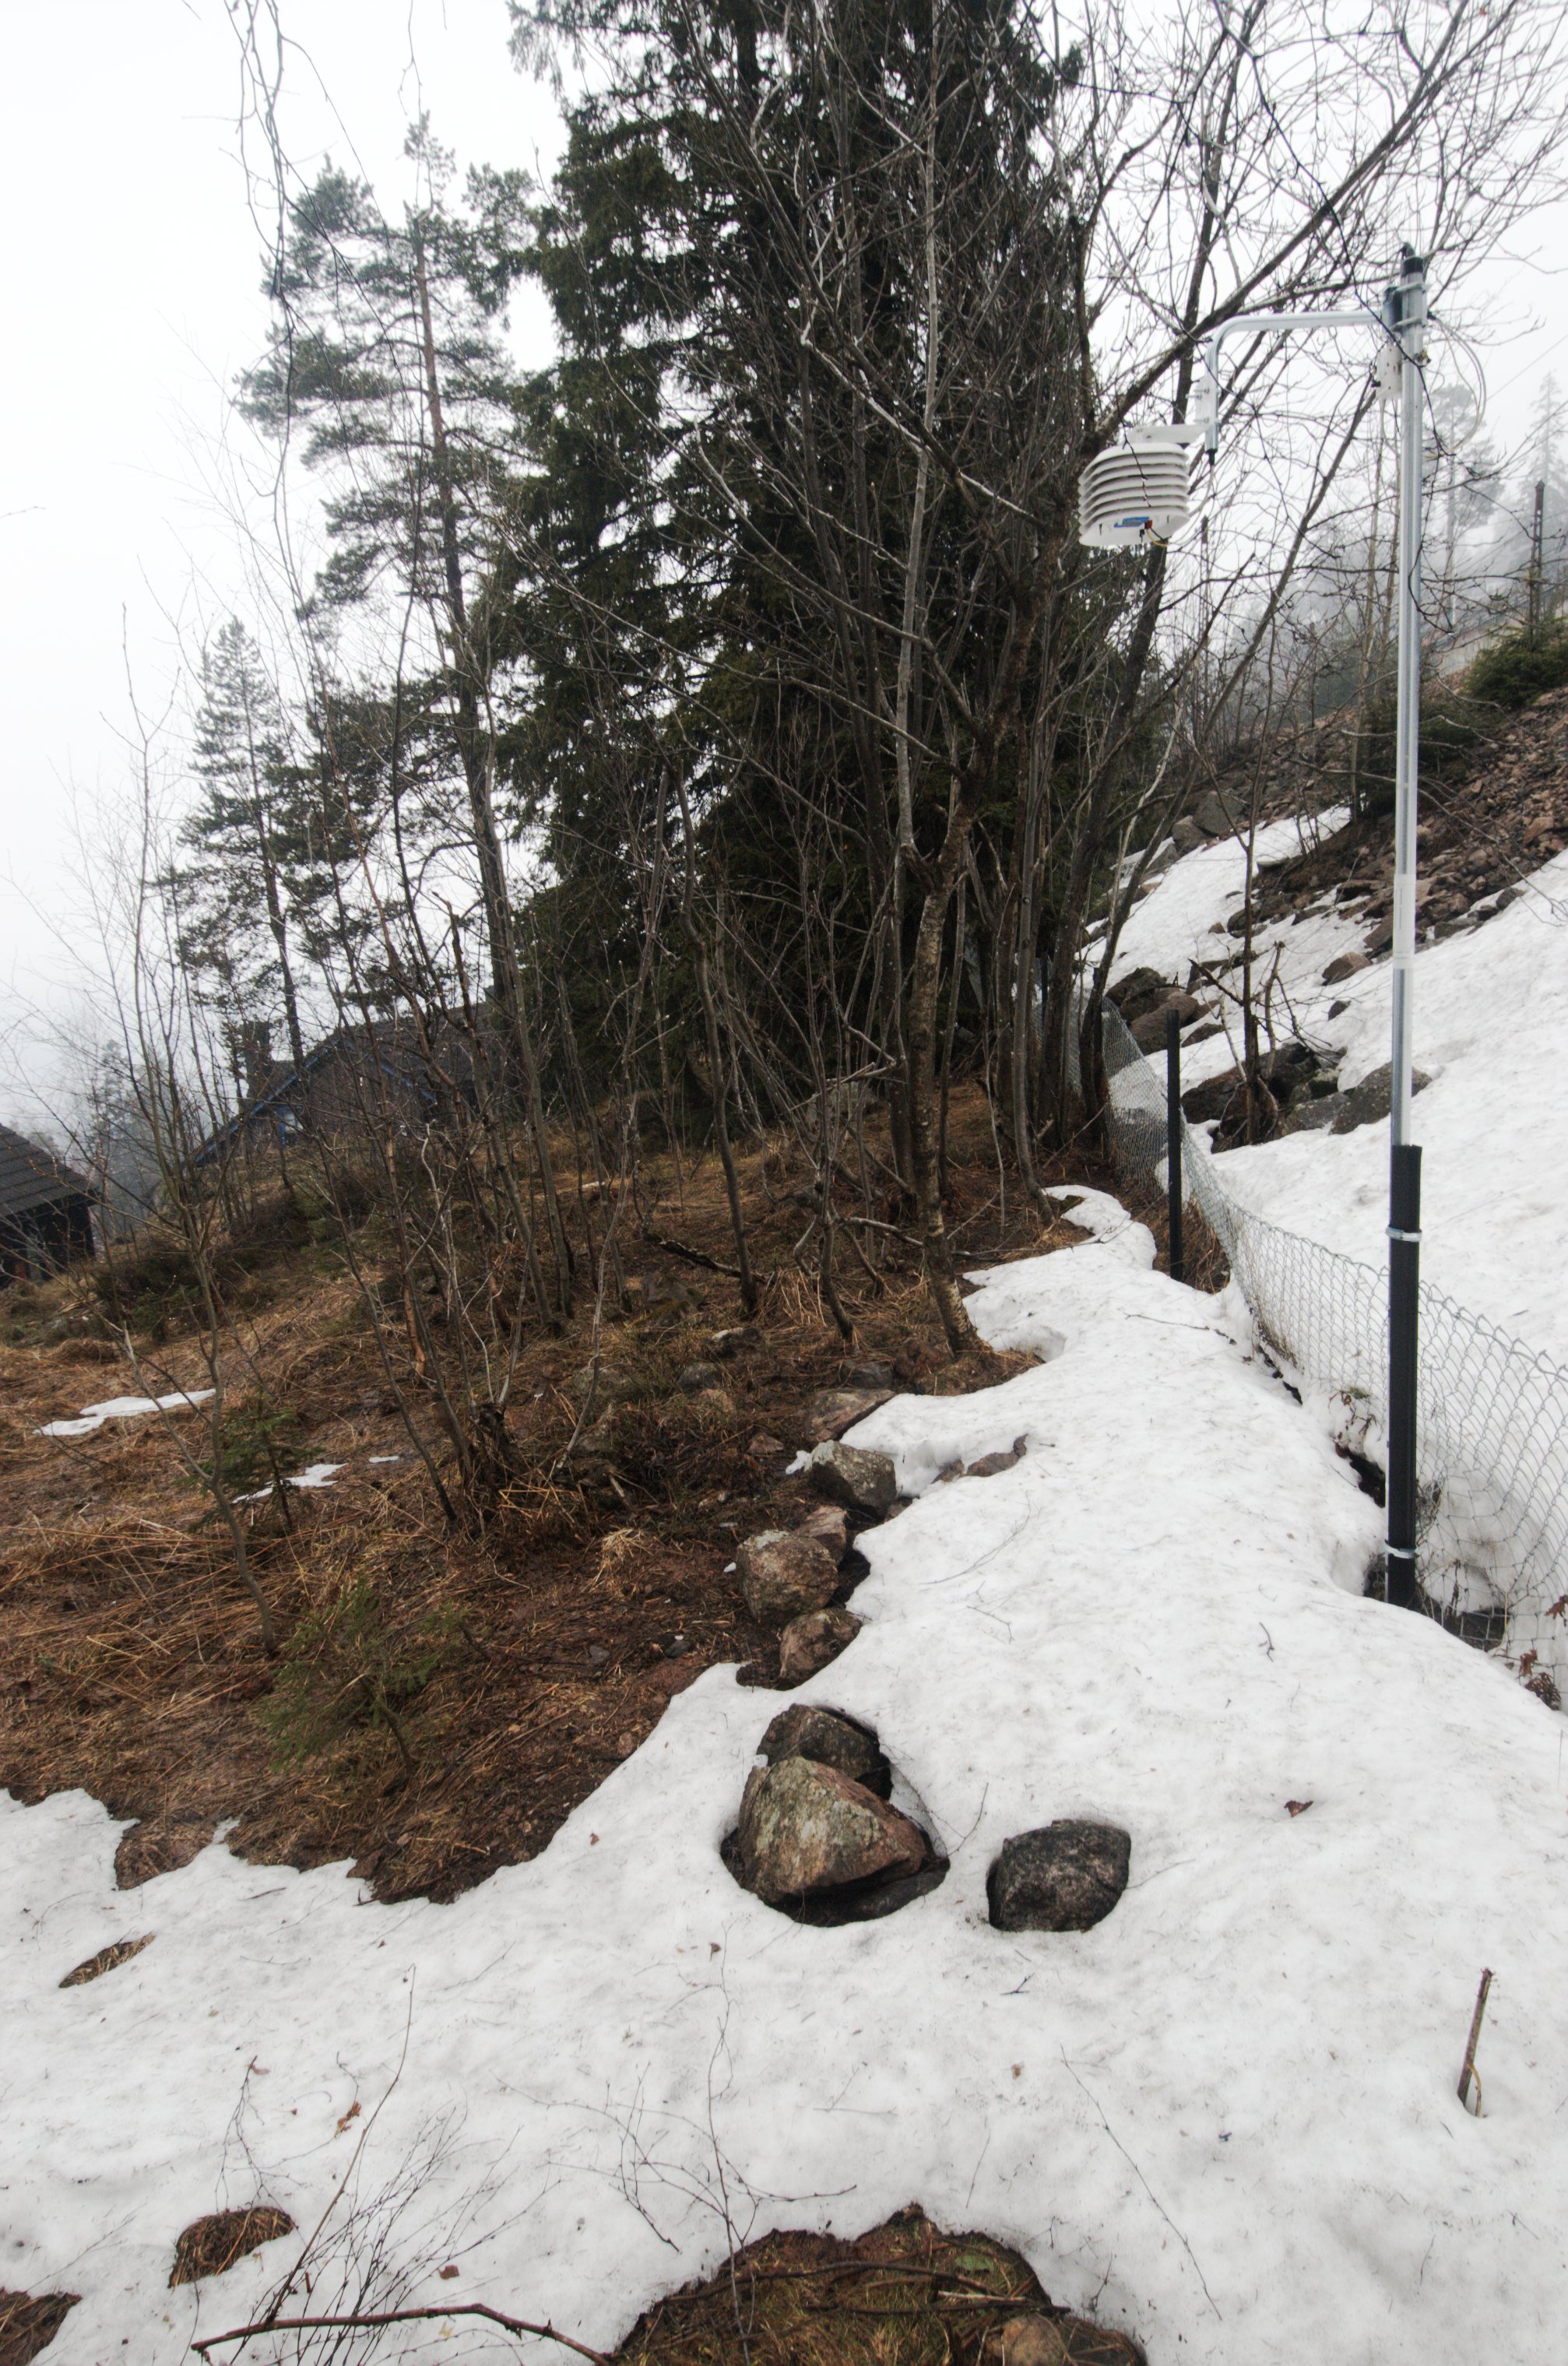
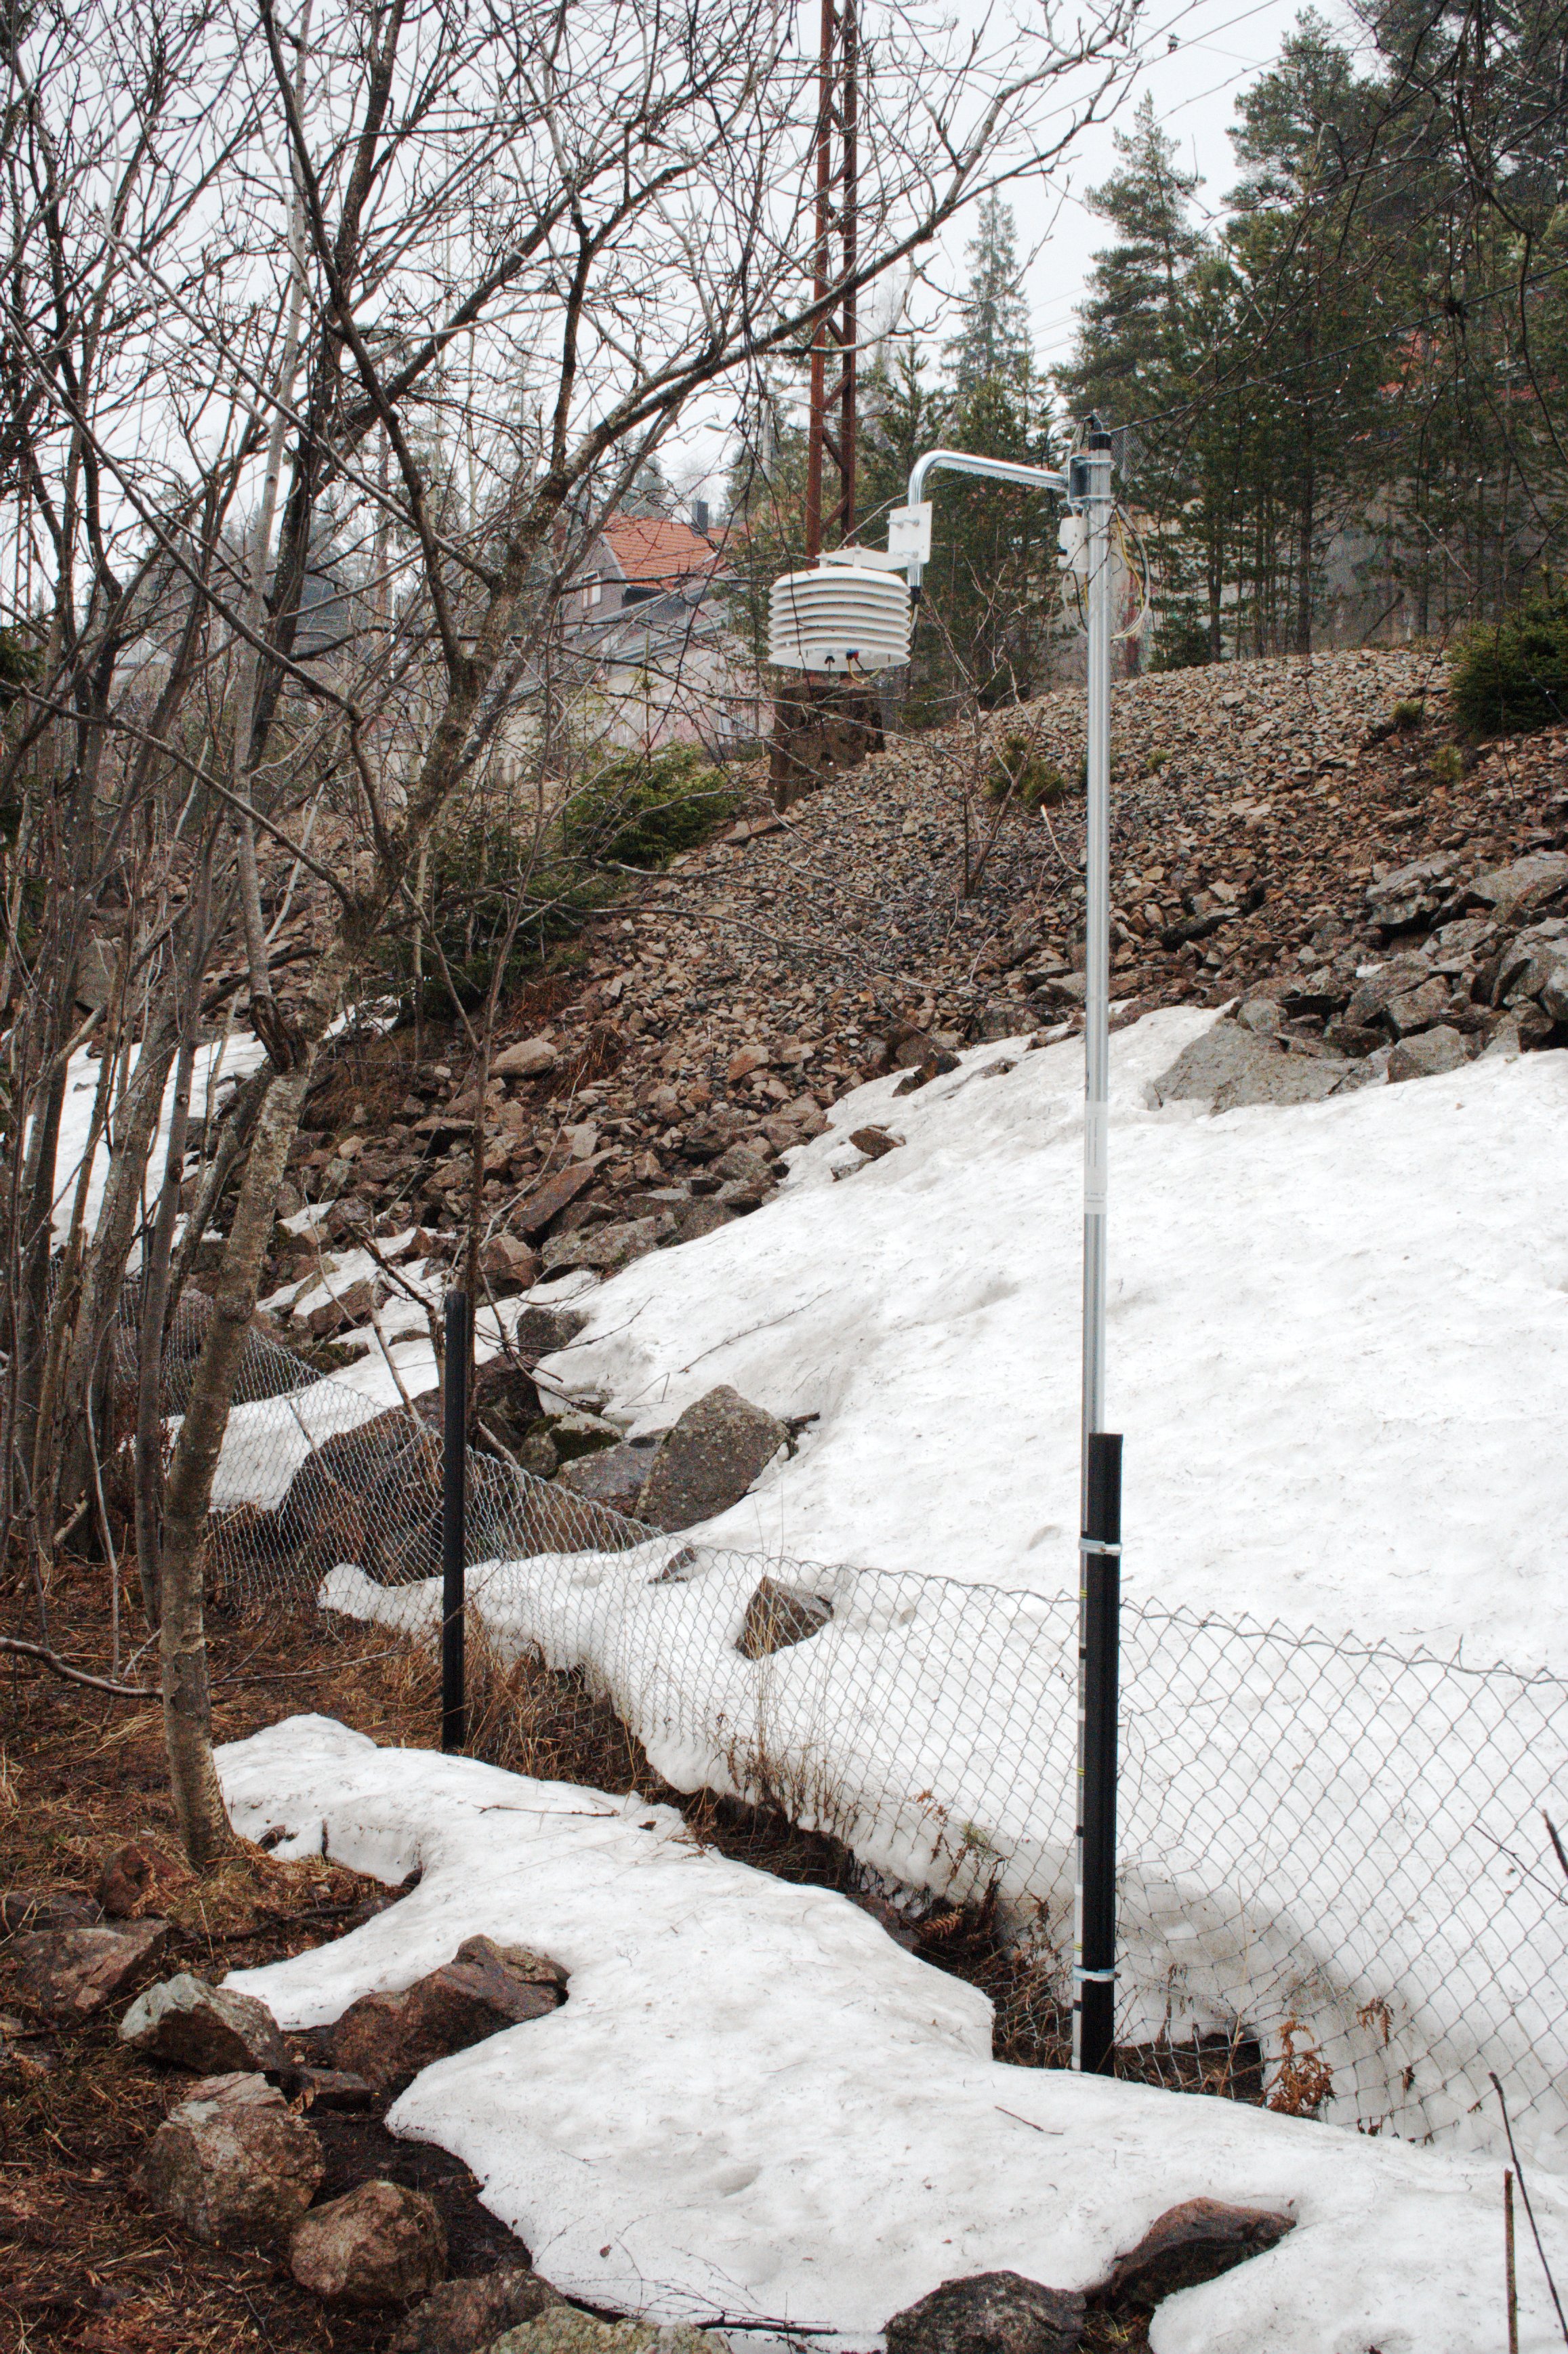
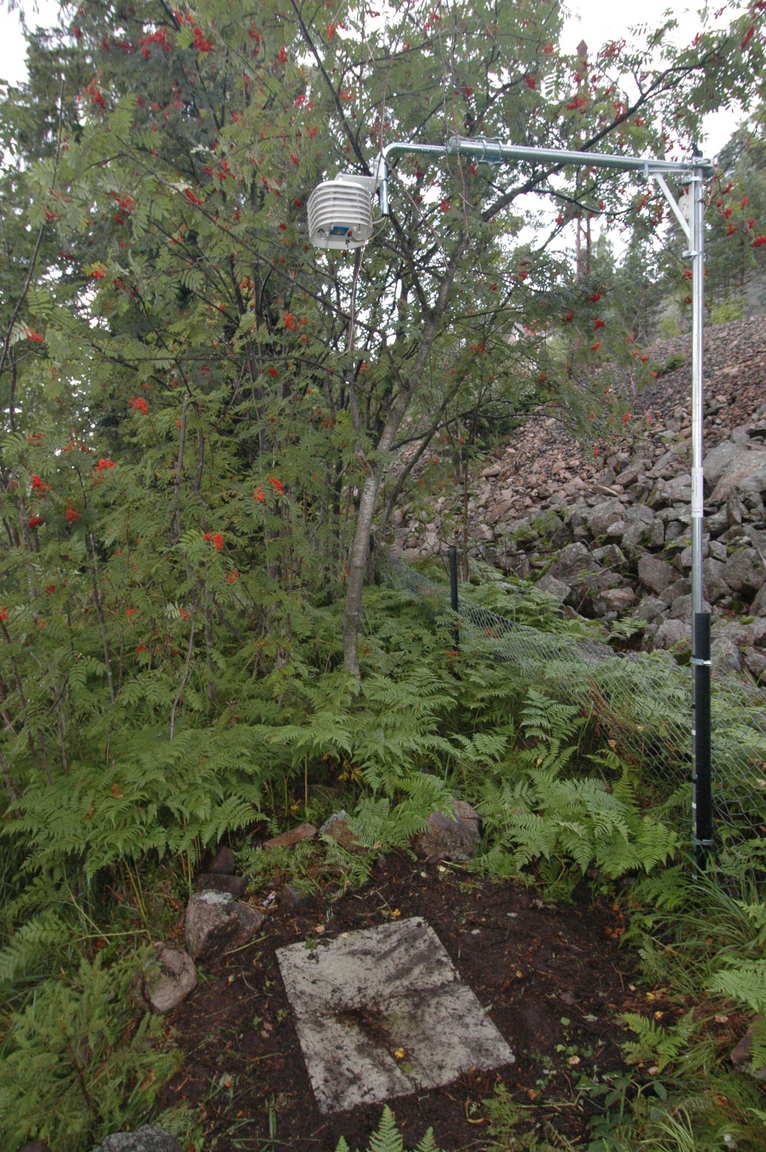
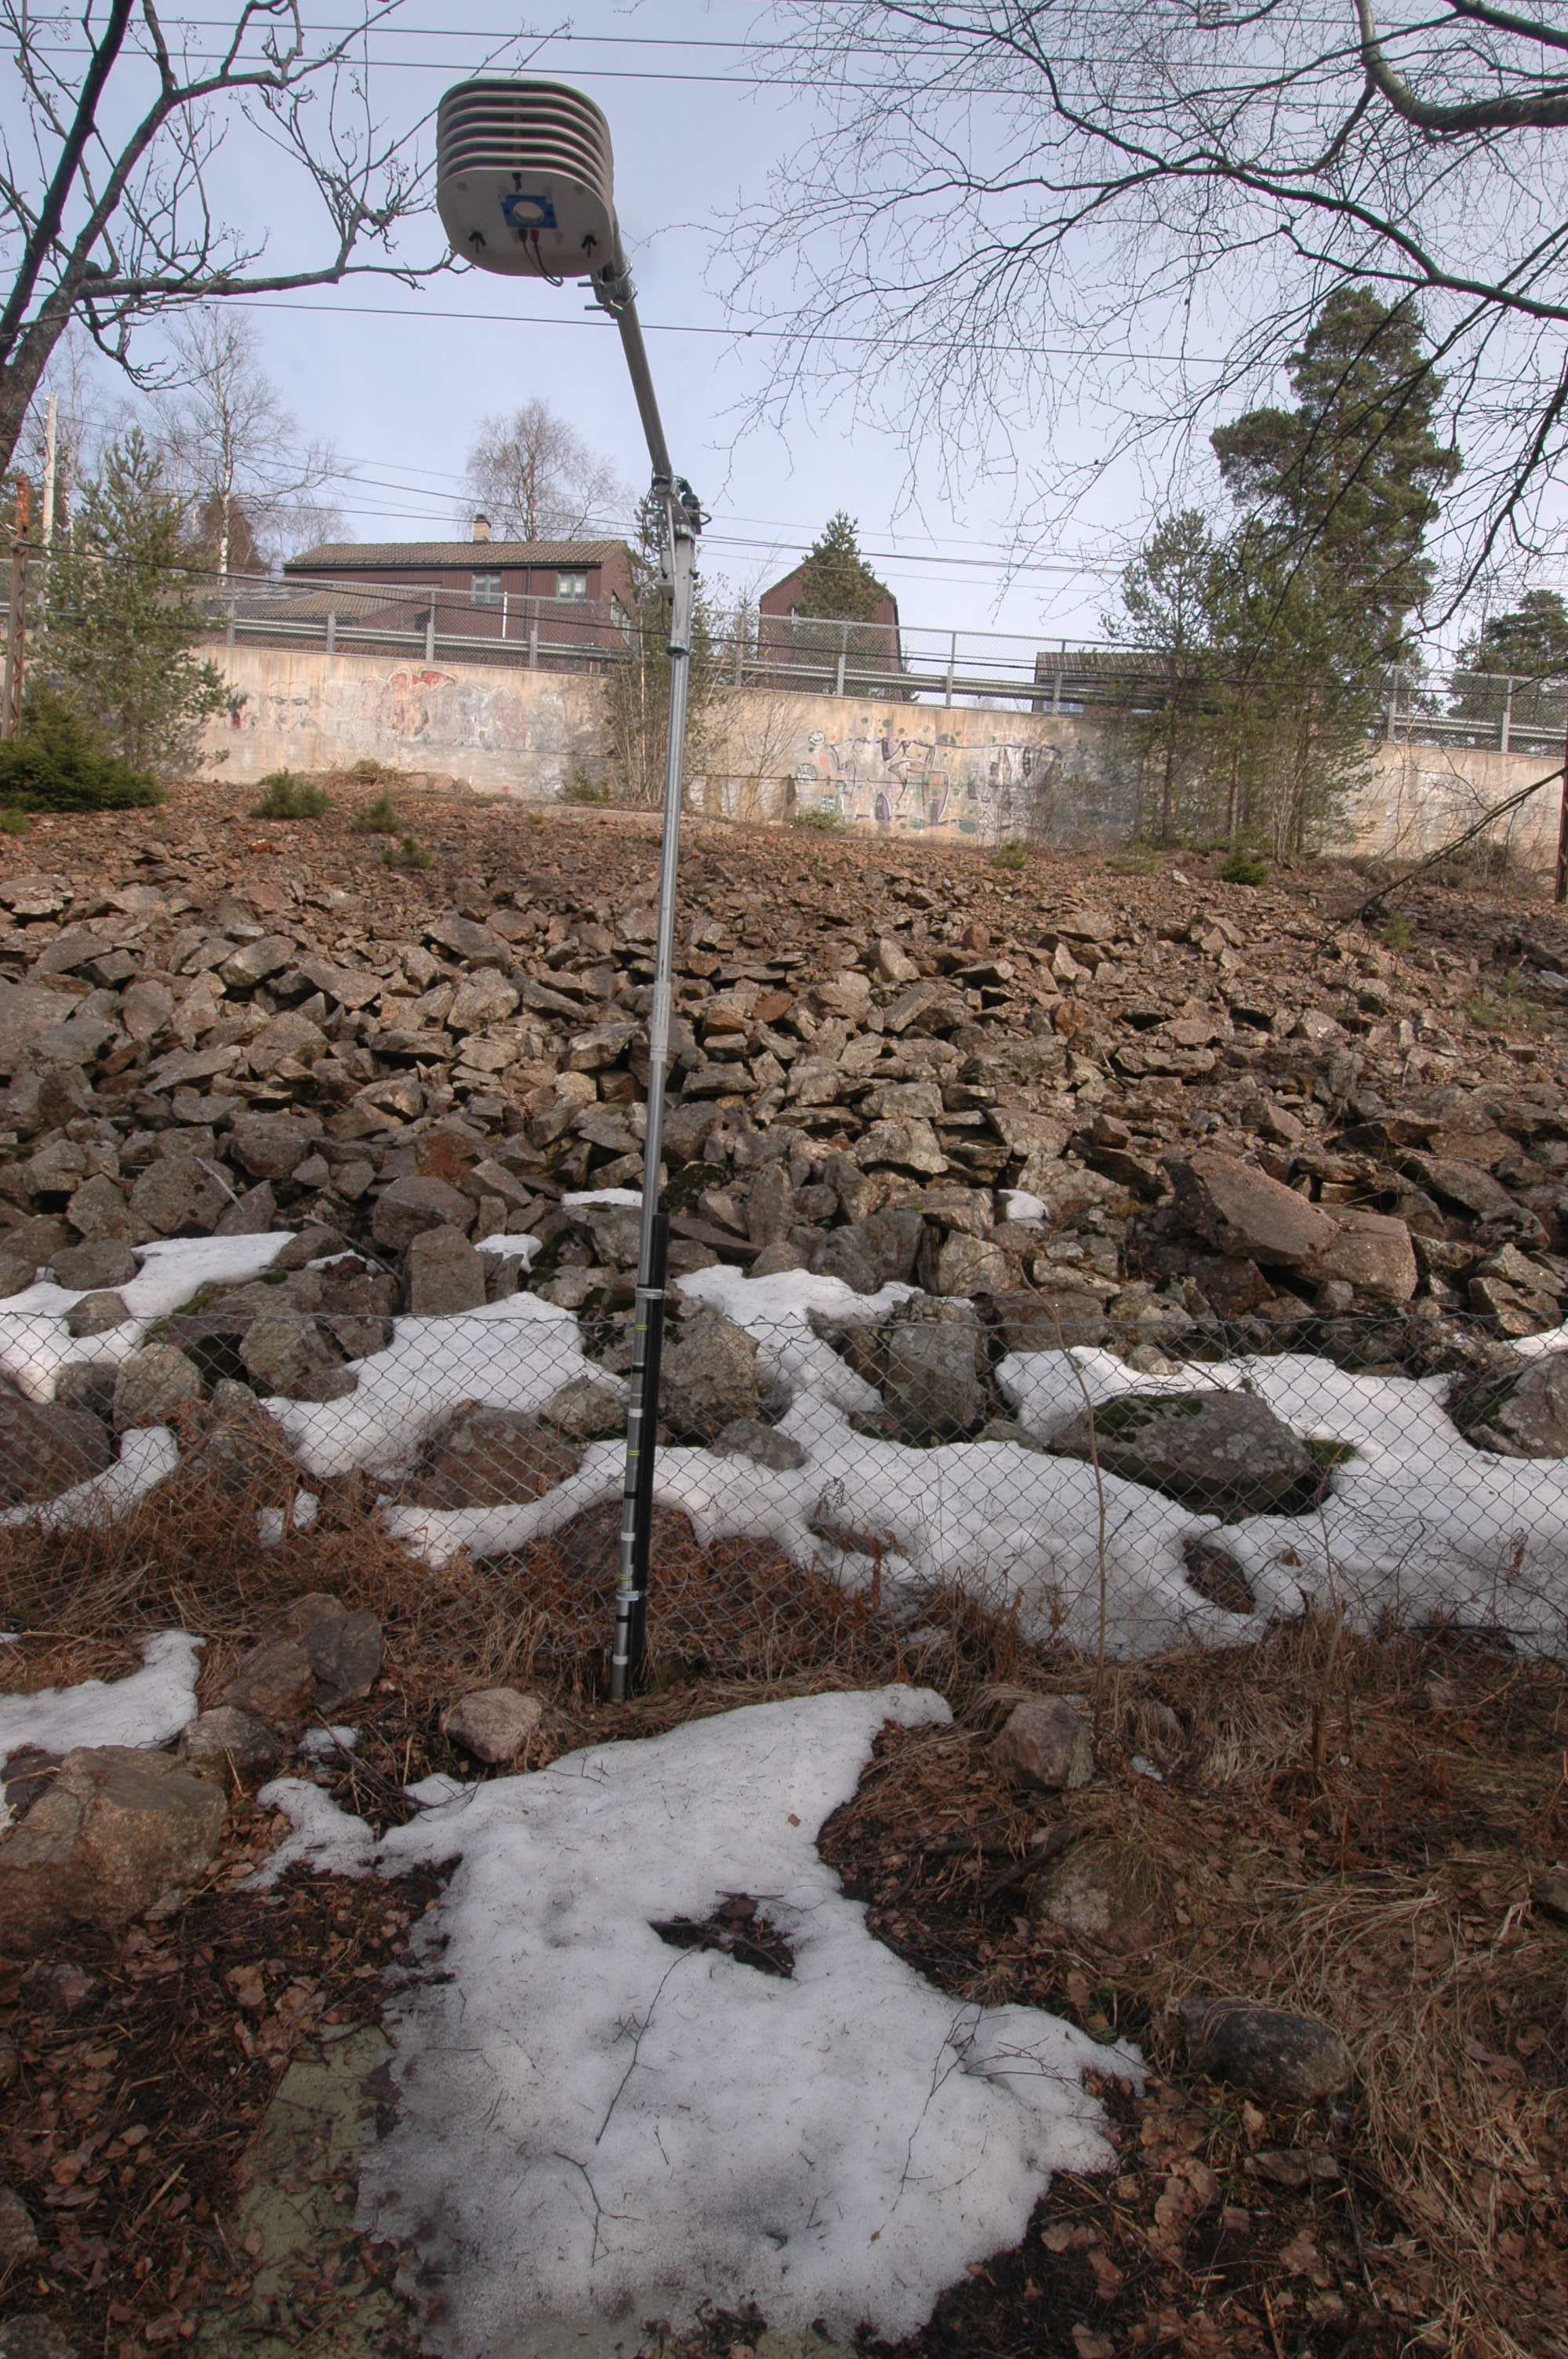
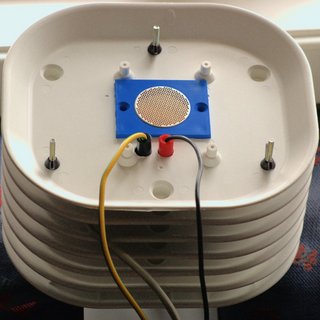
Assembled sensor.
|

| |
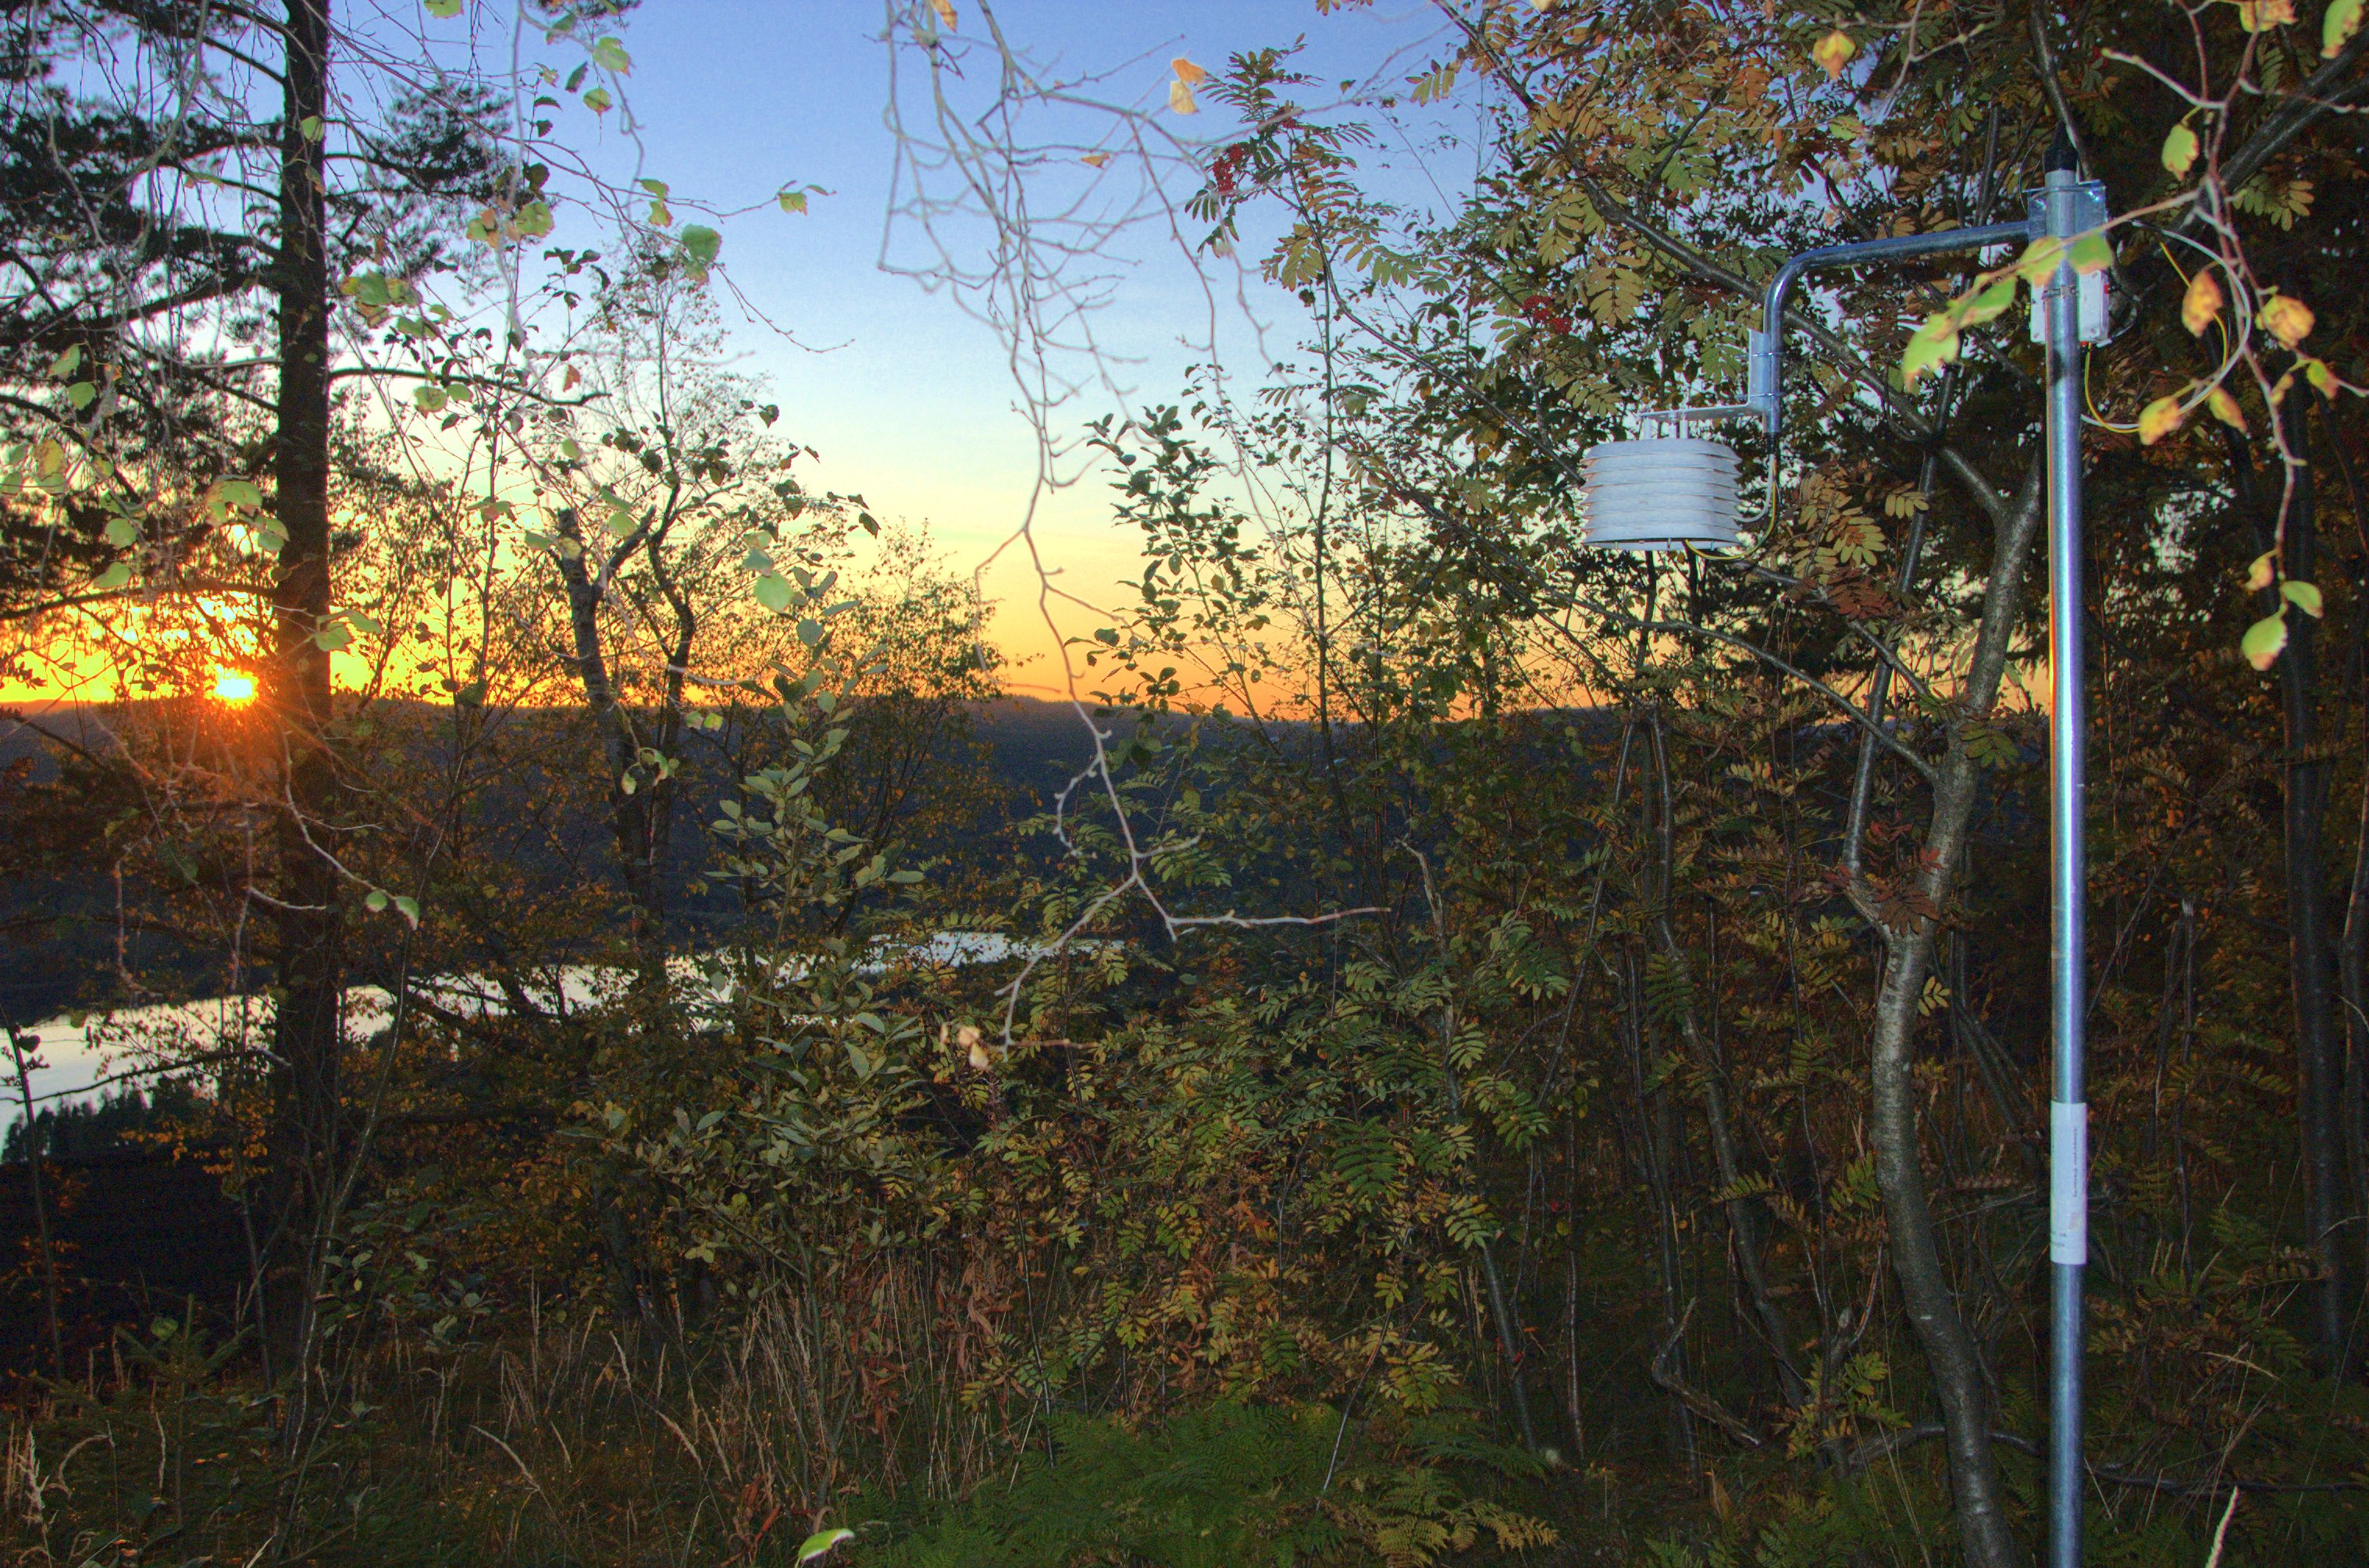
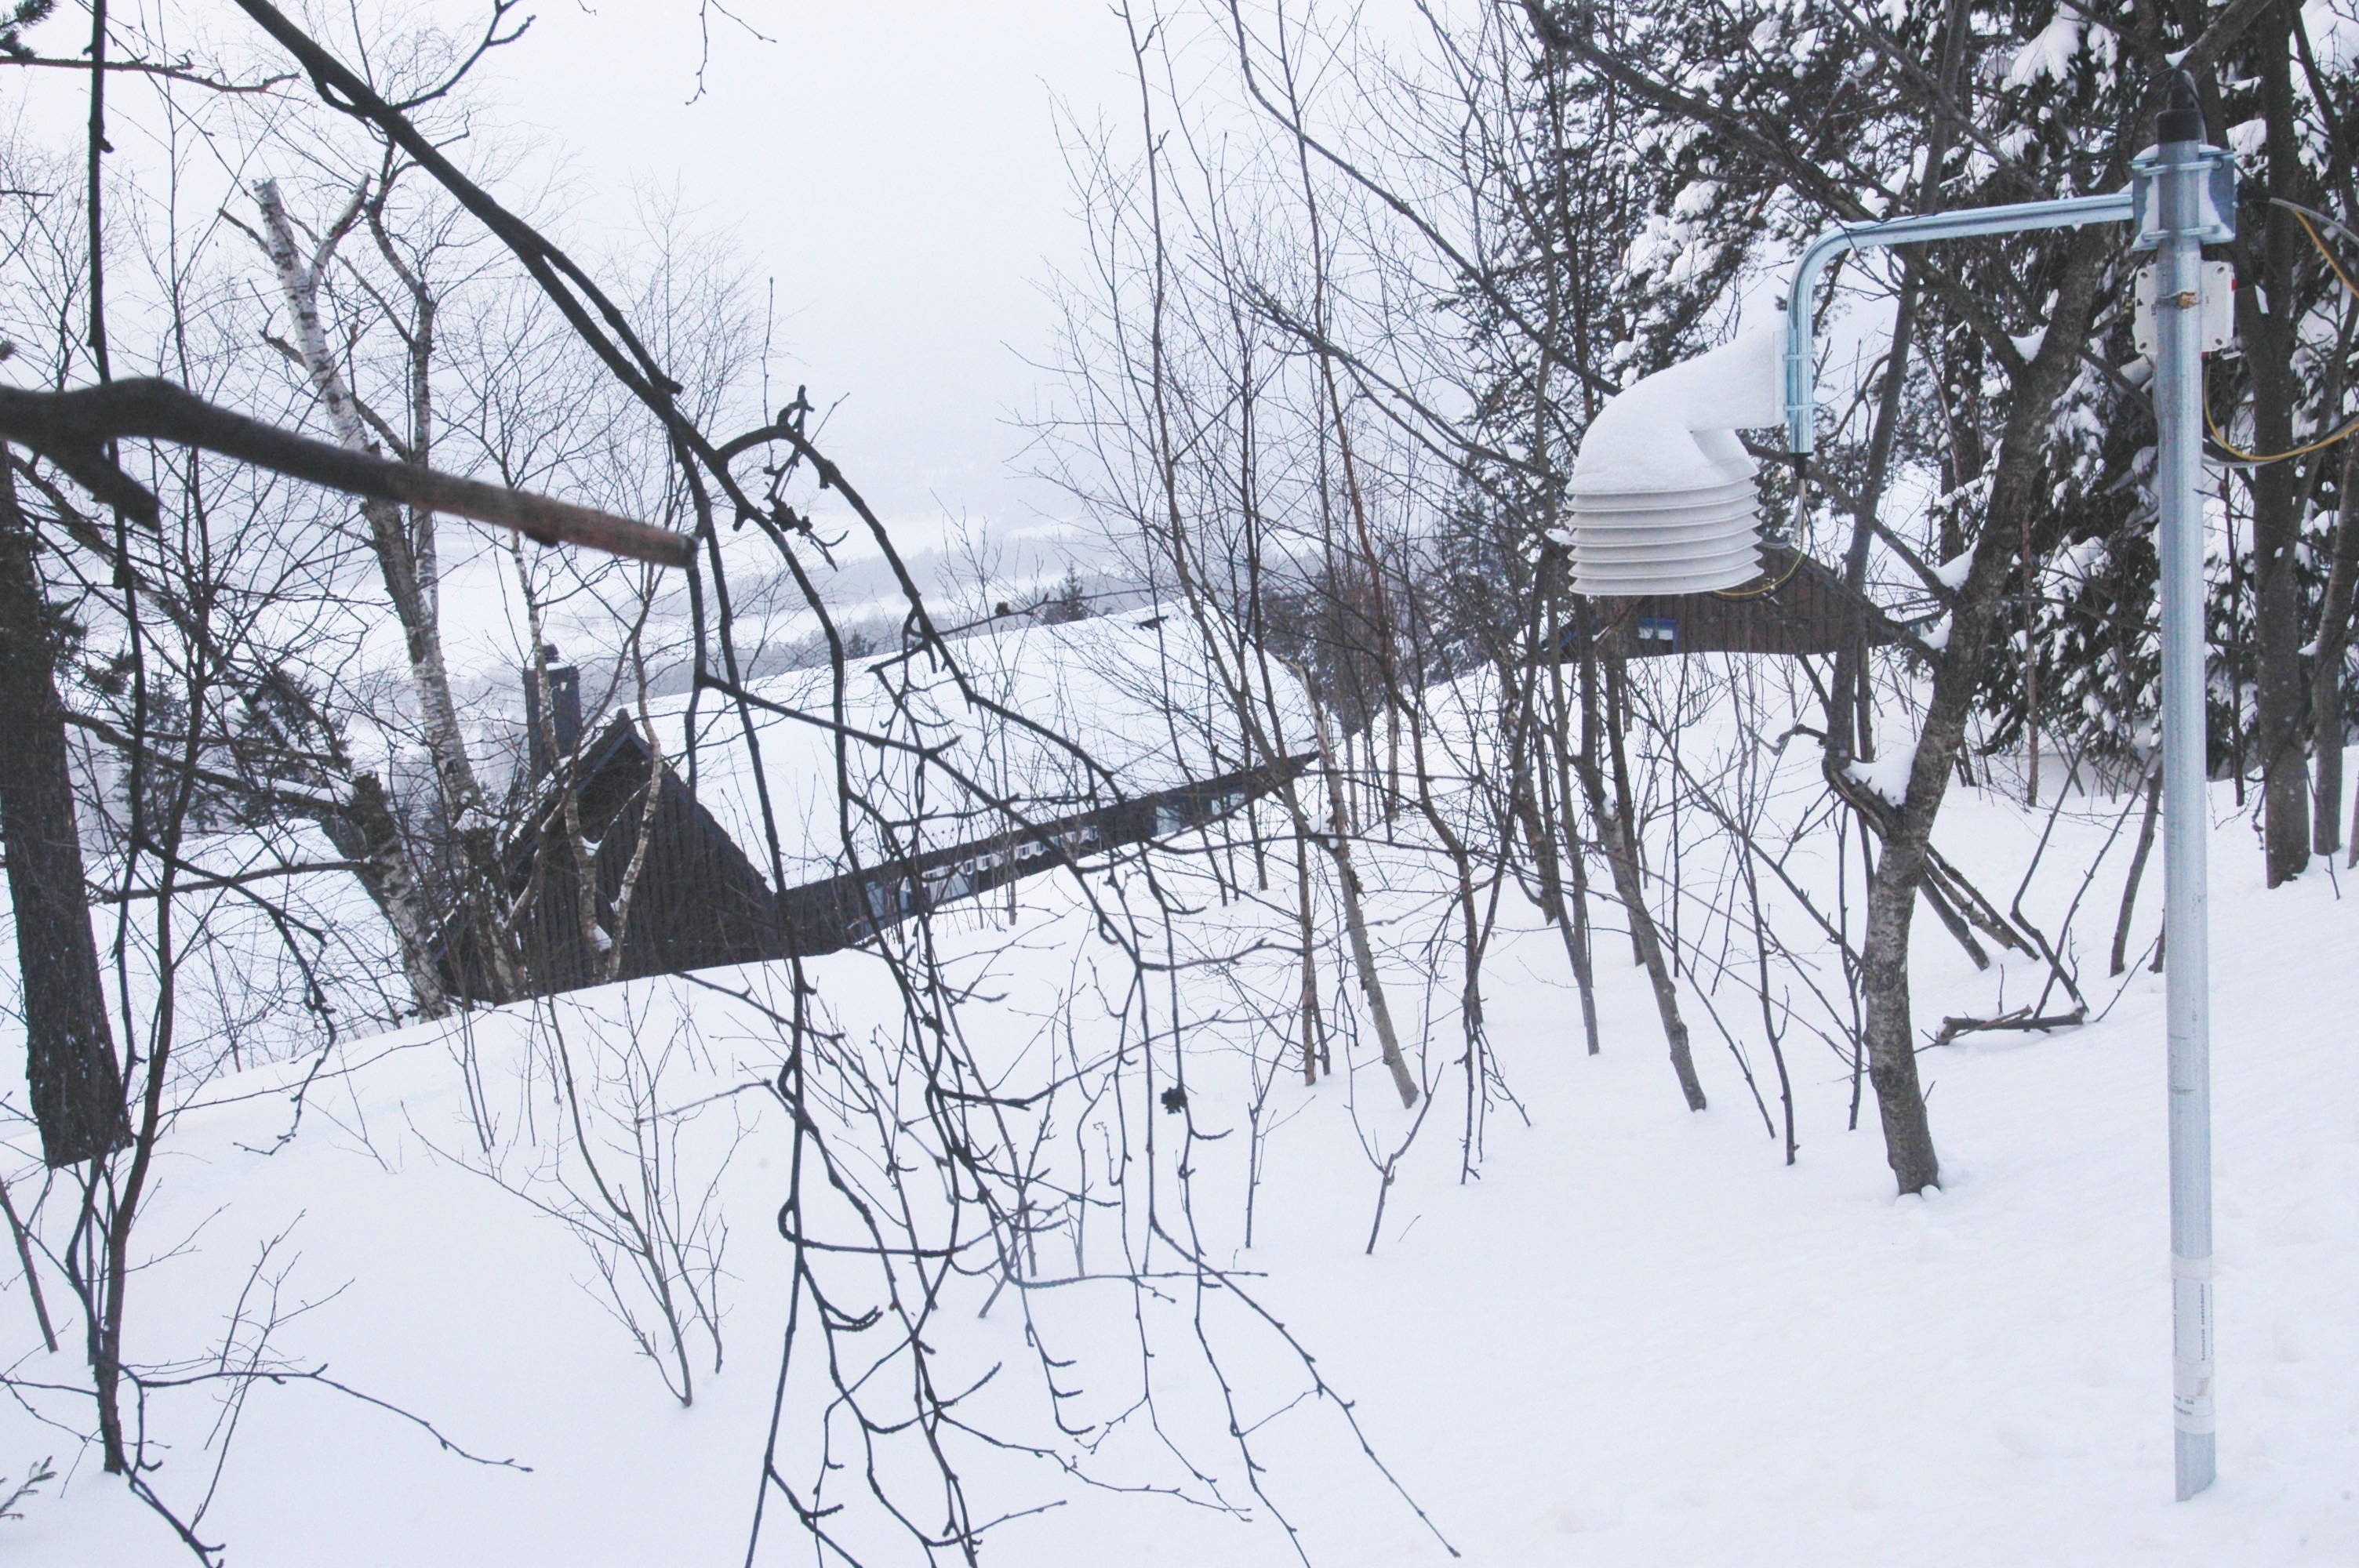
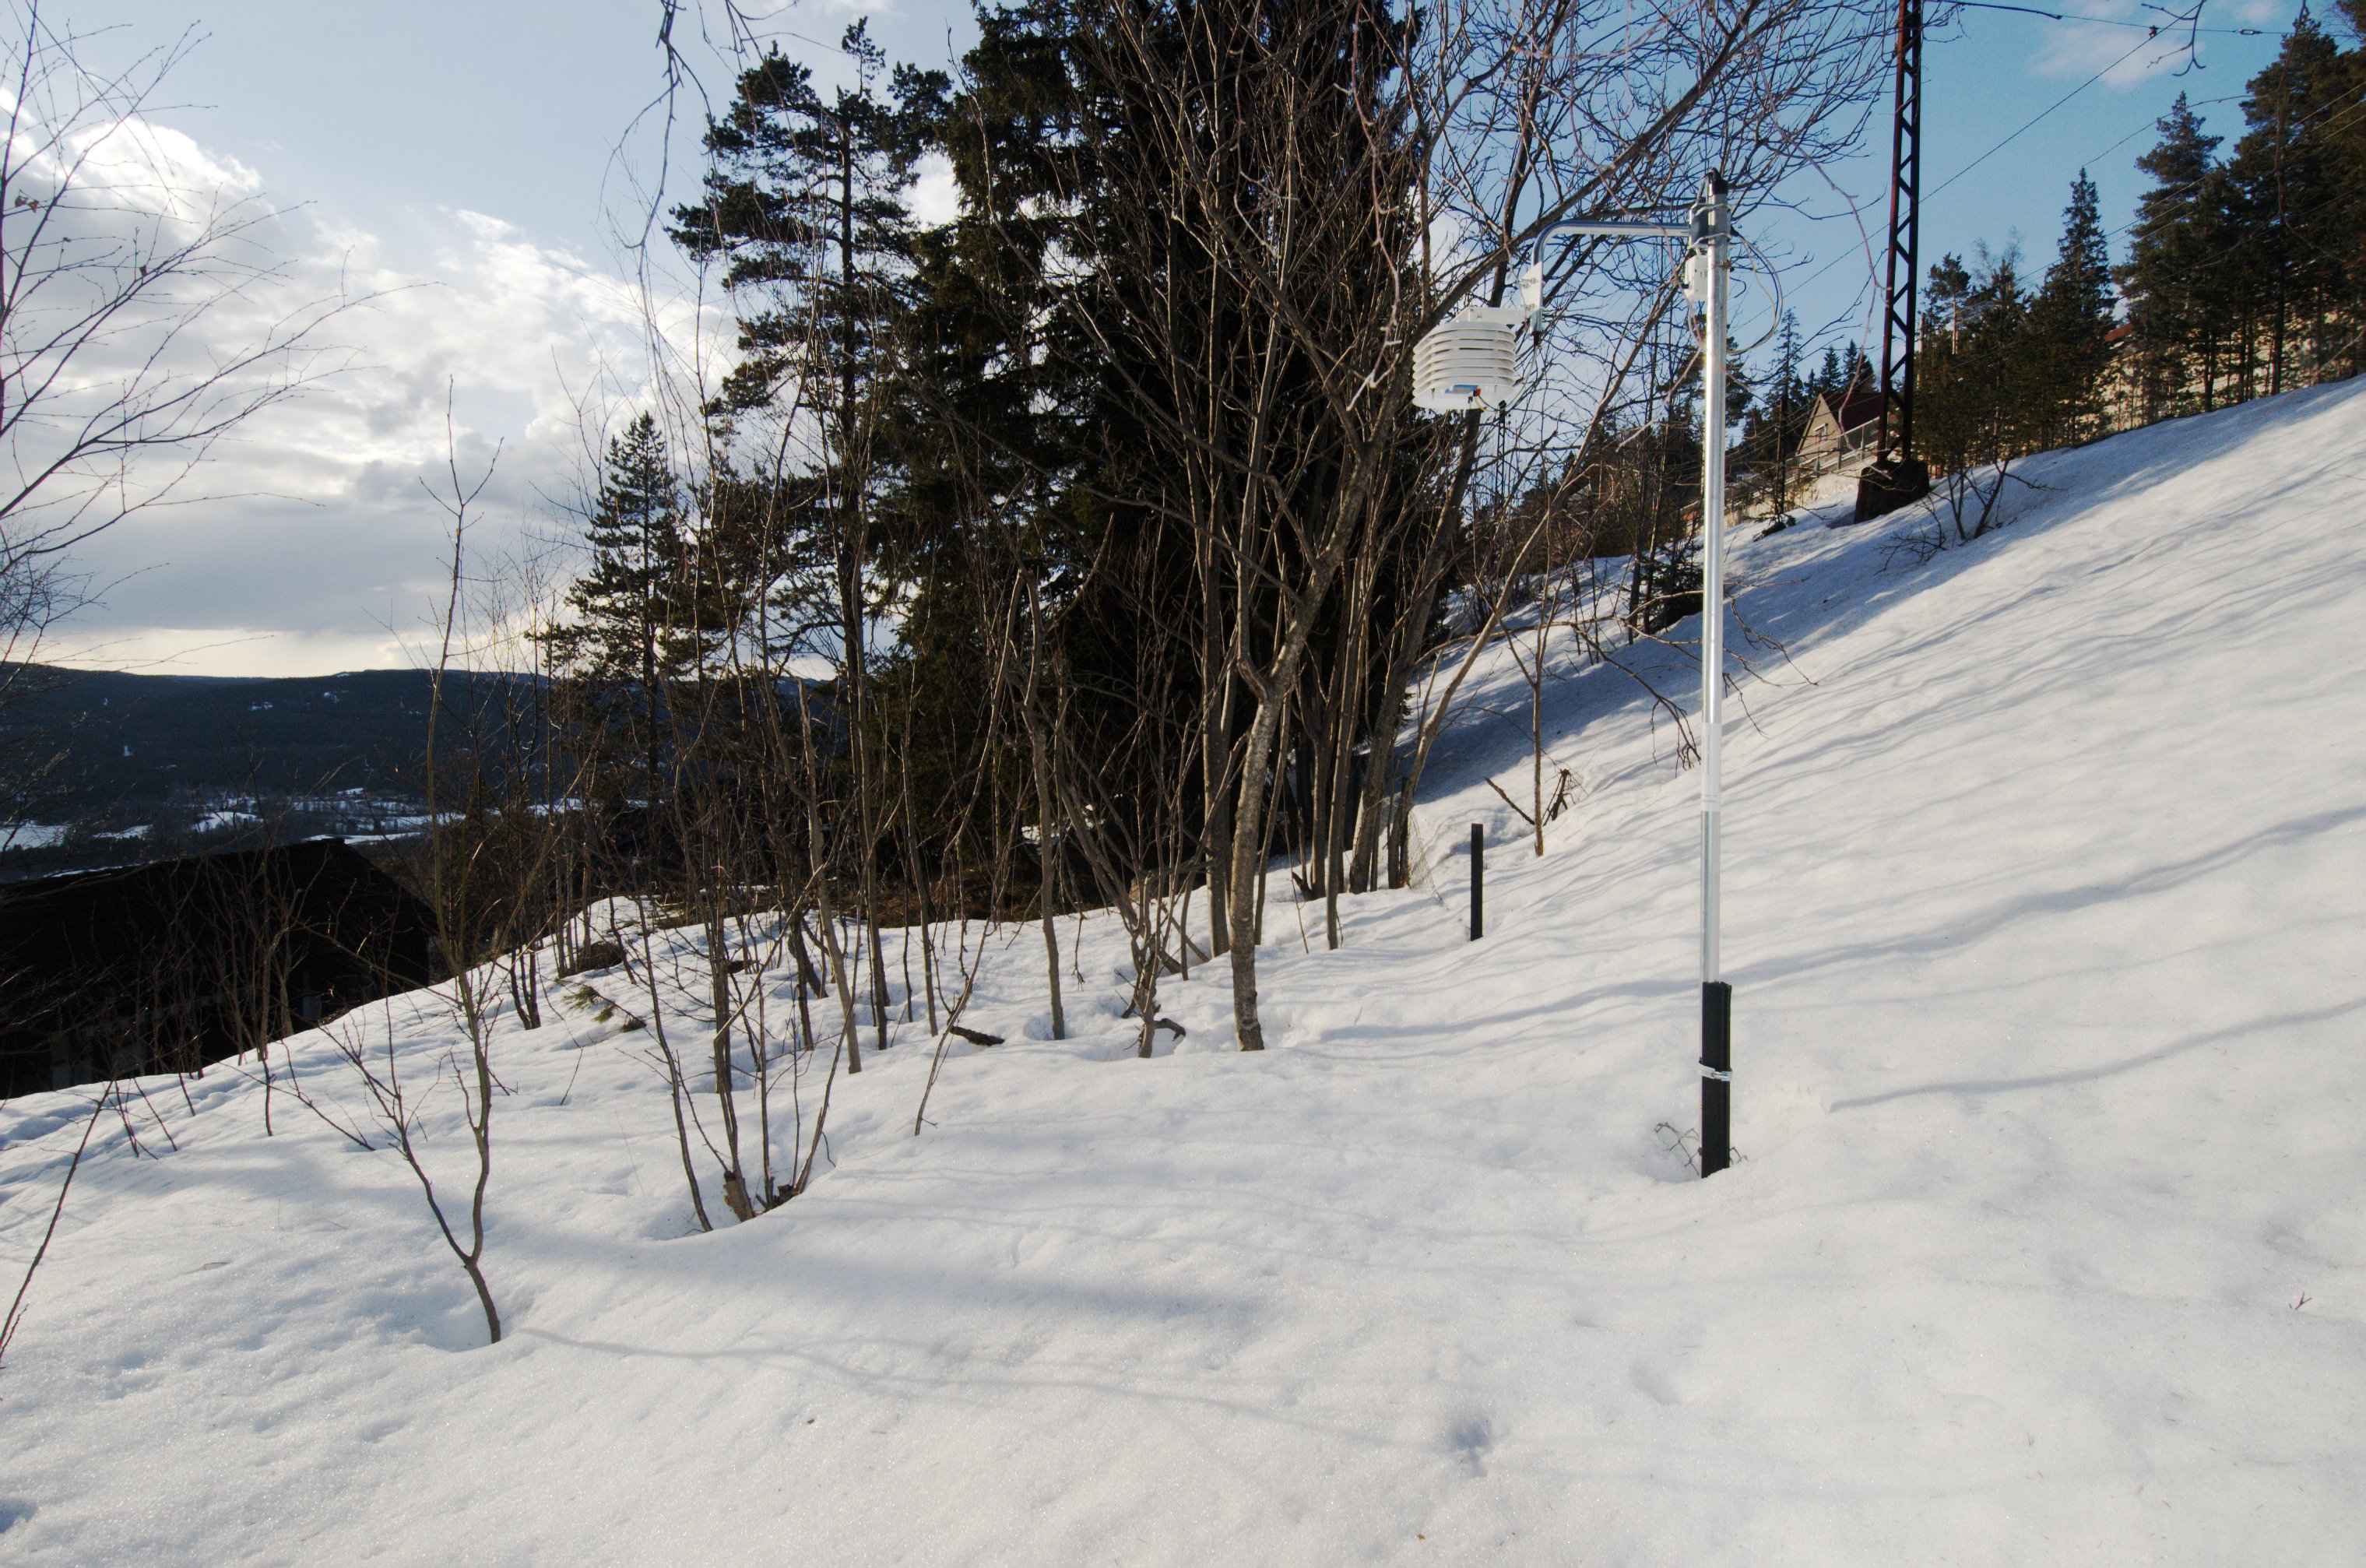
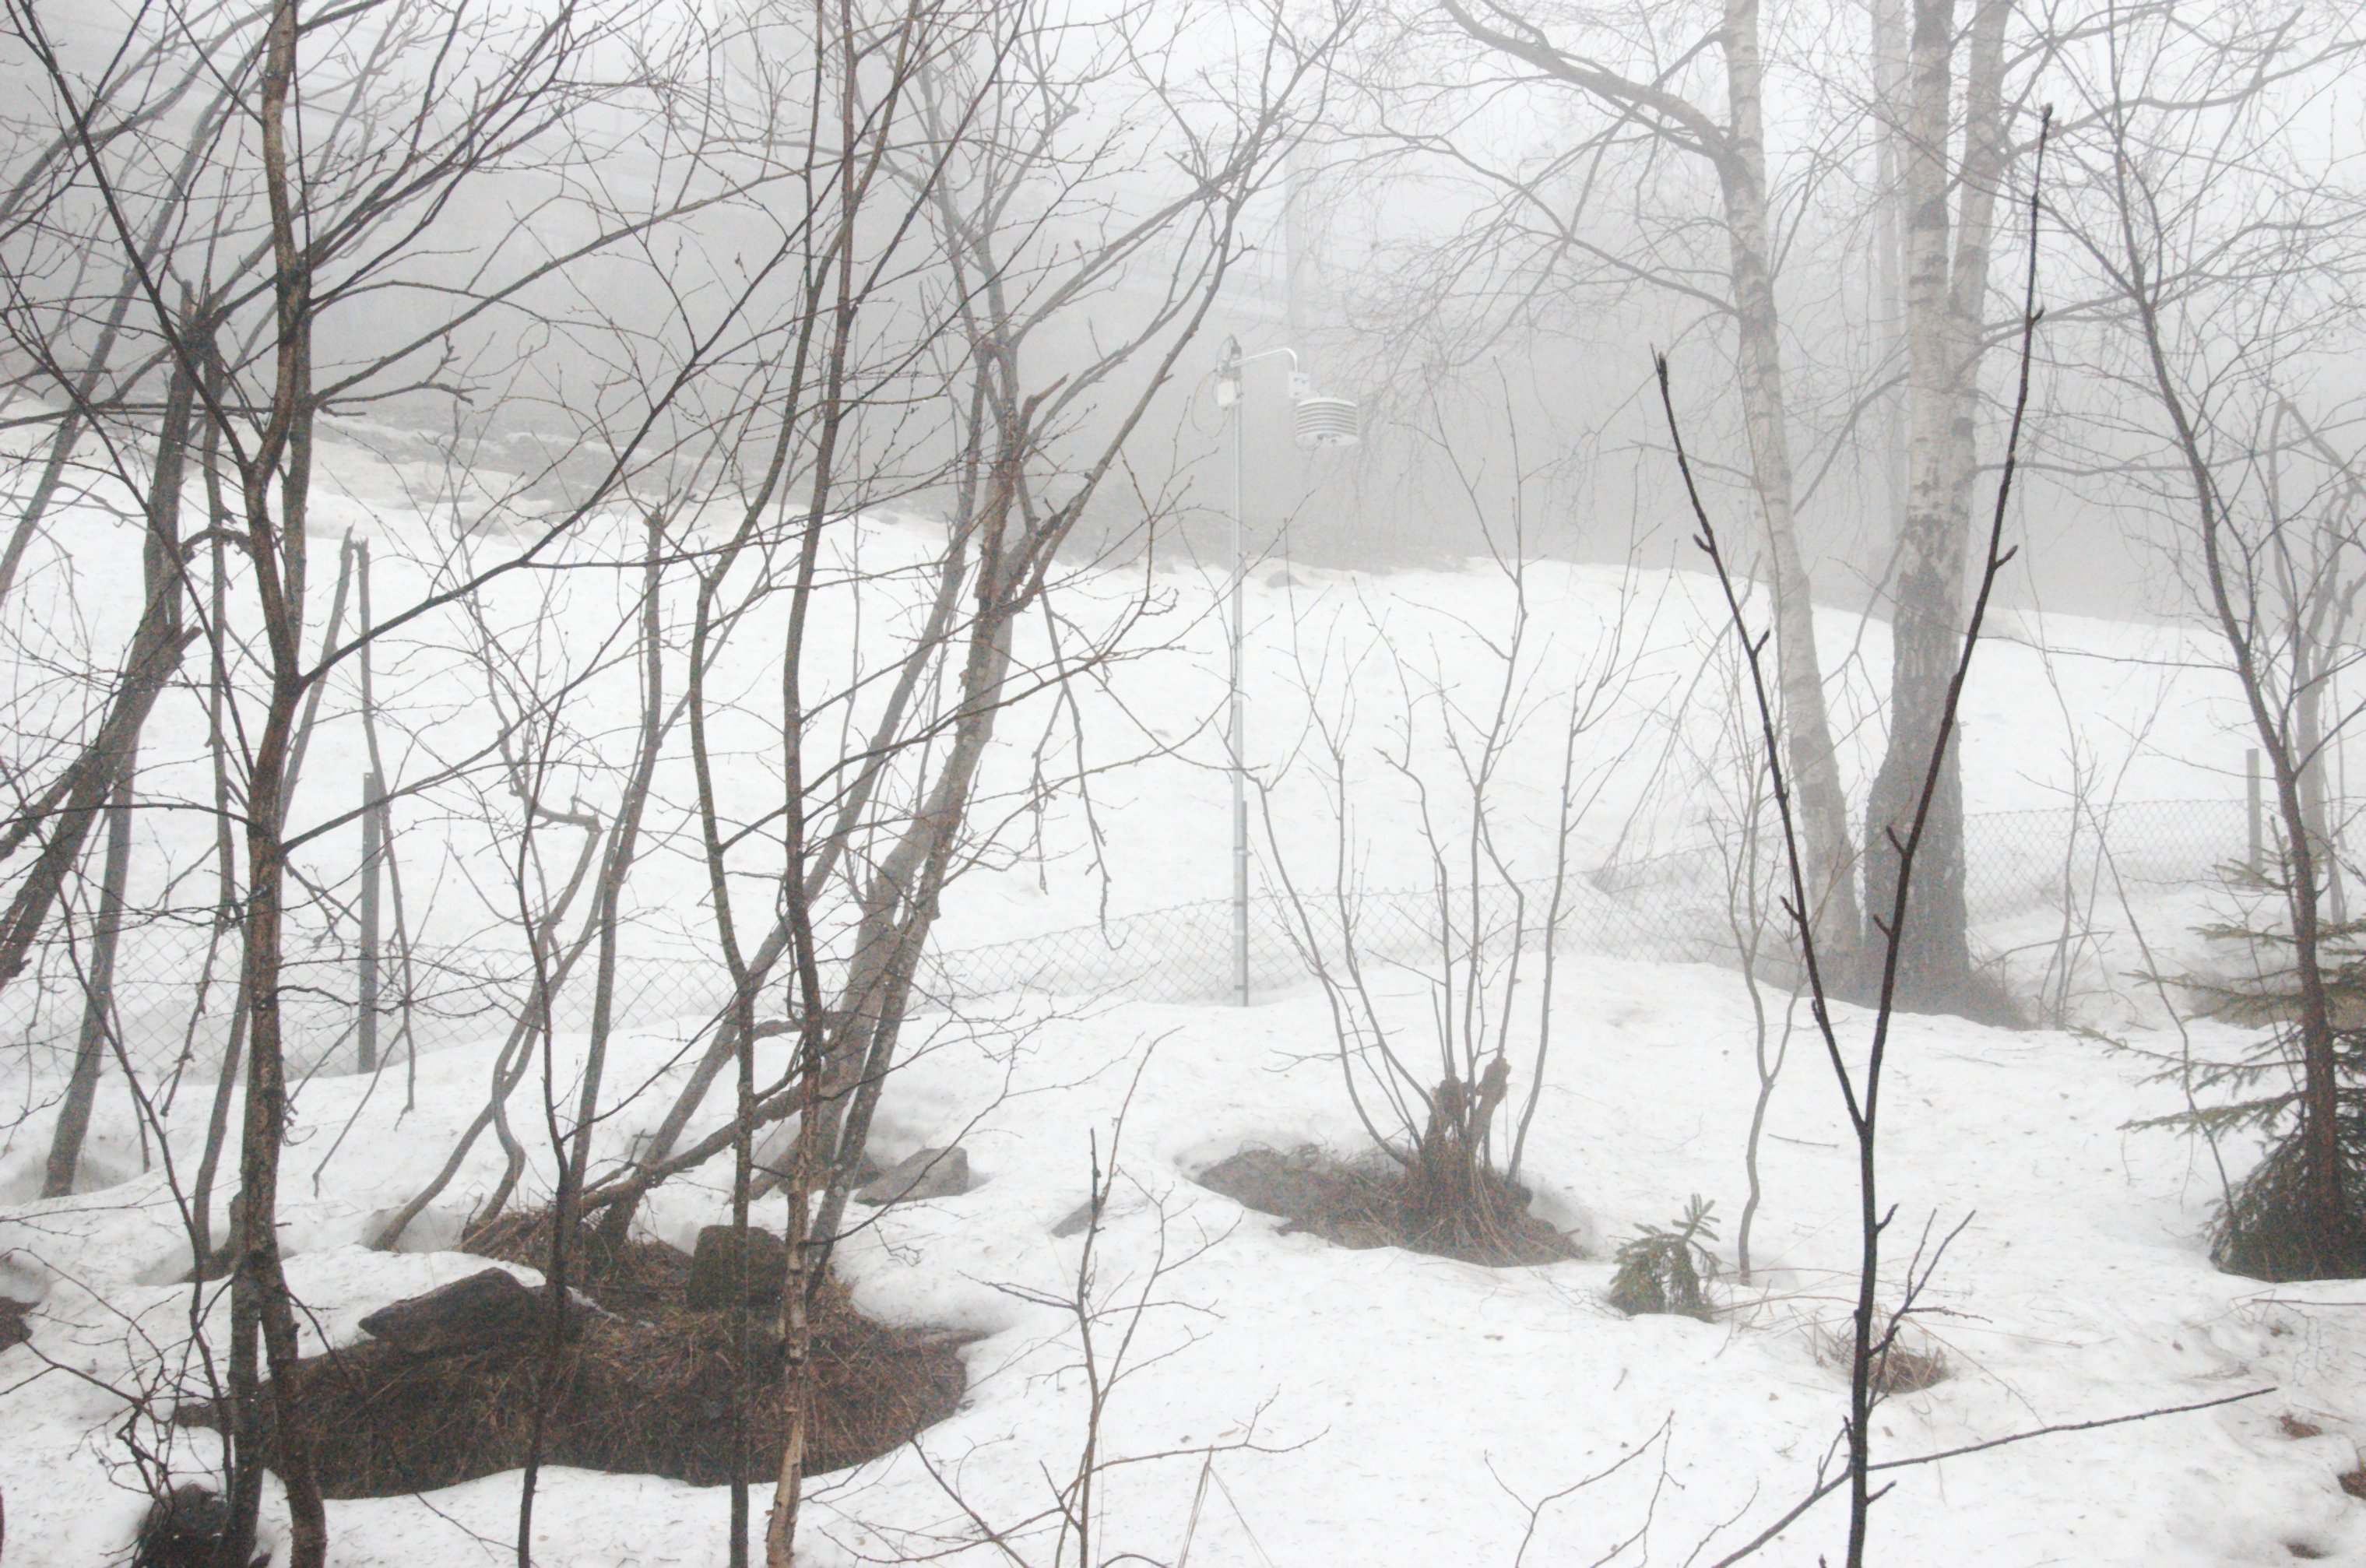
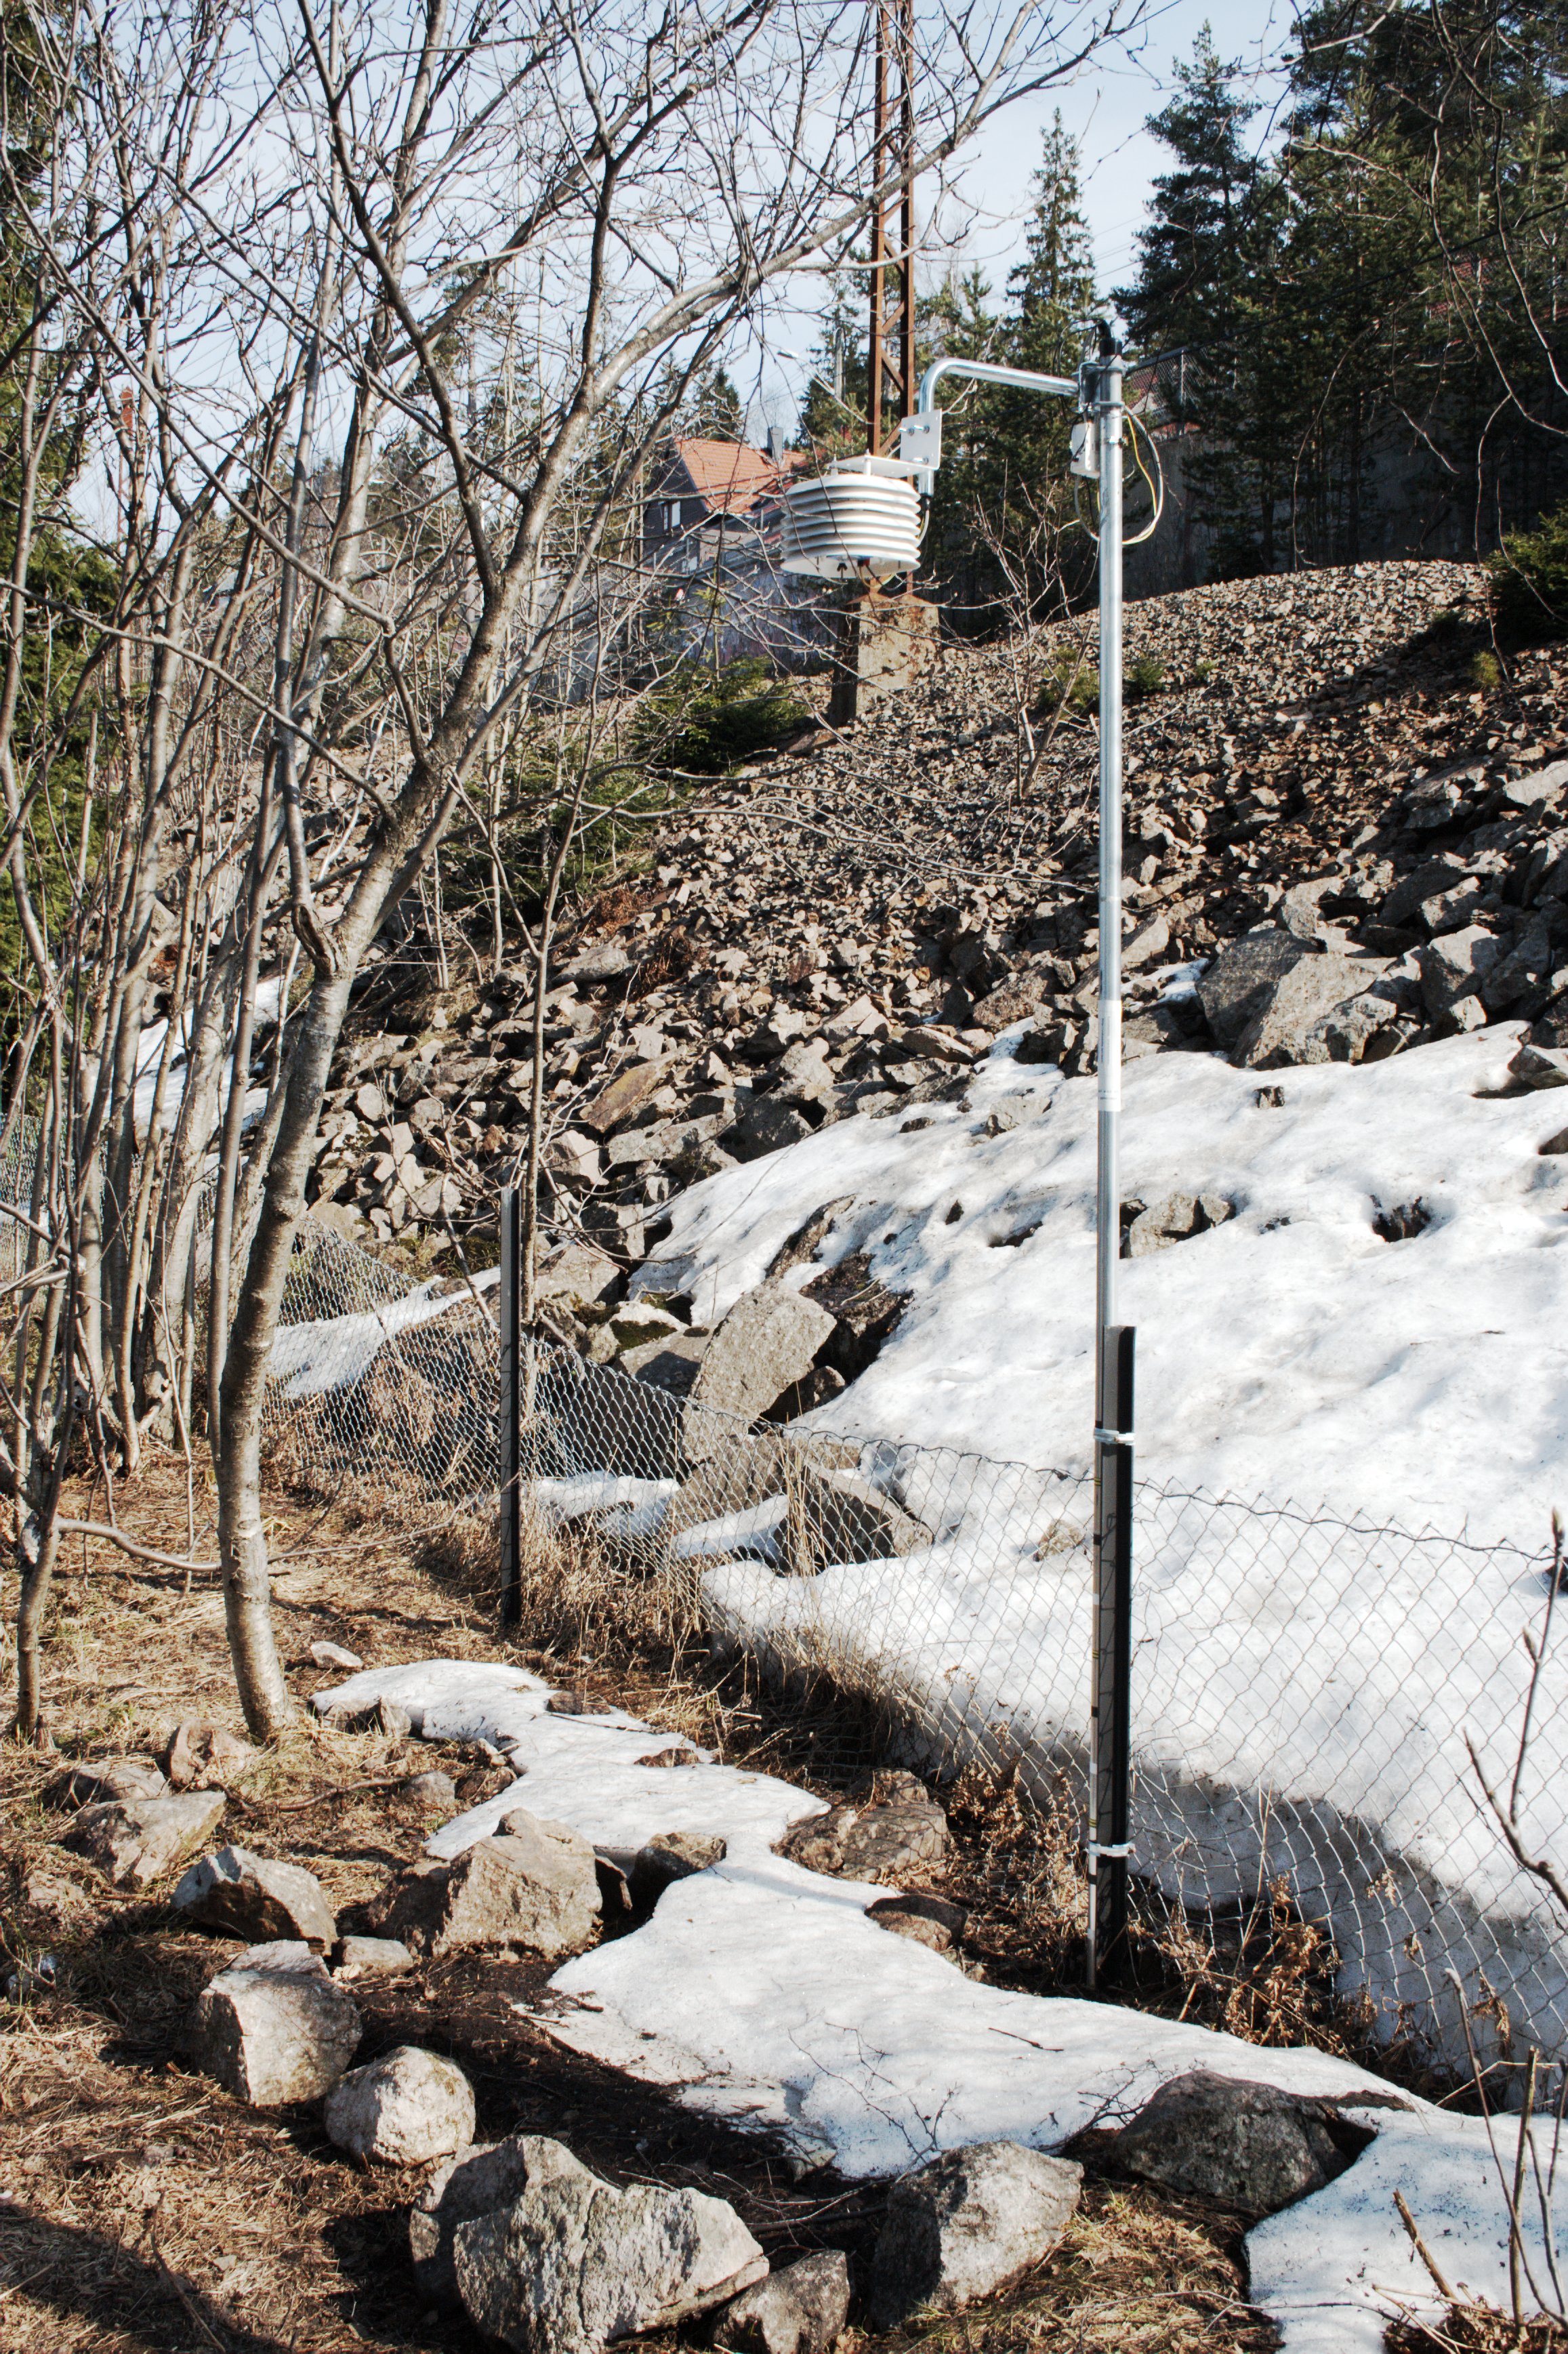
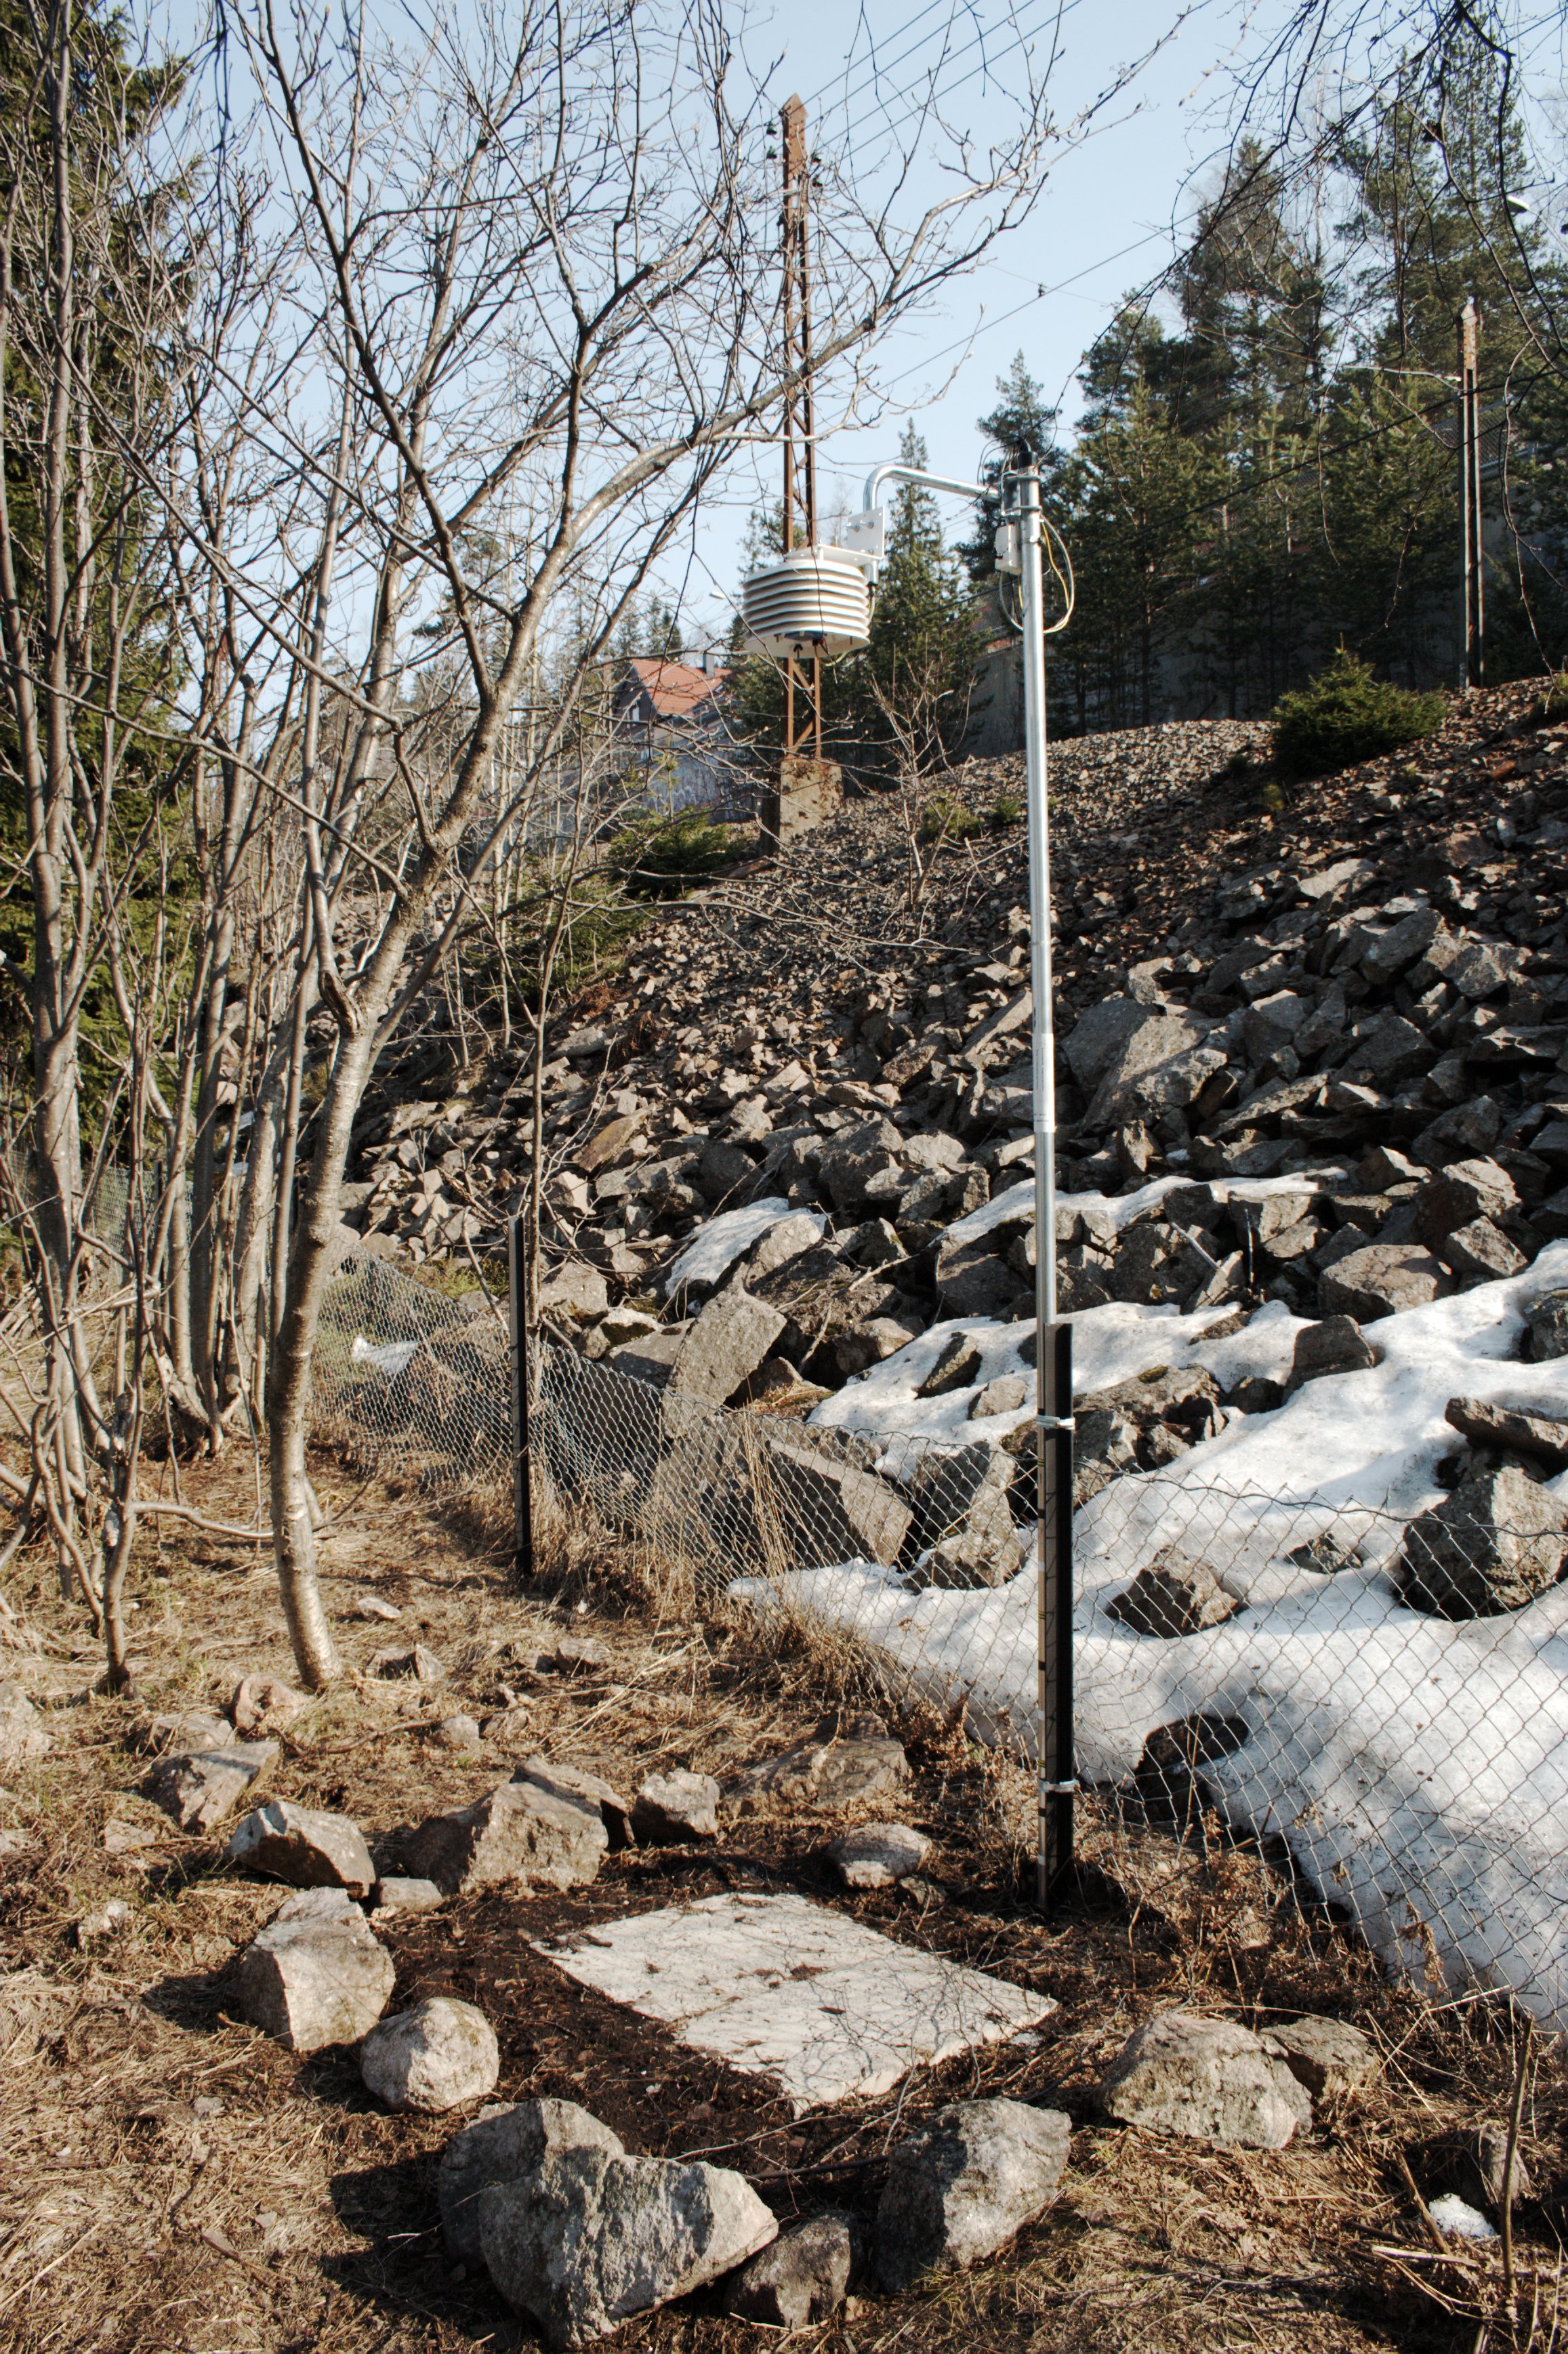
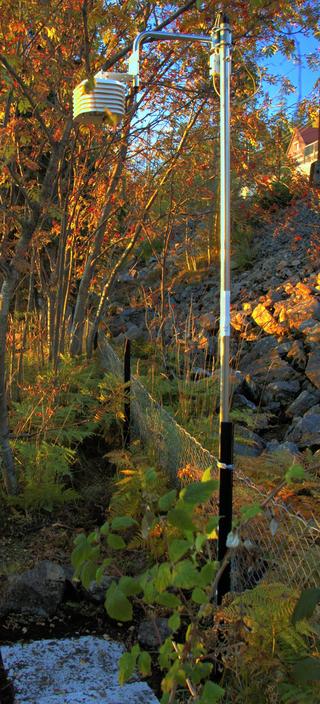
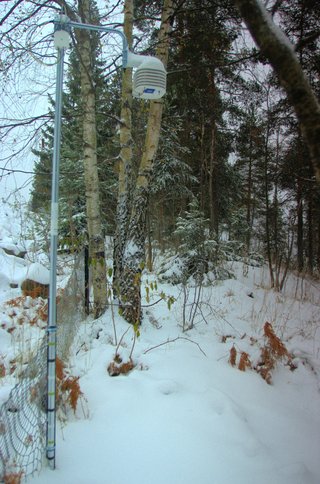
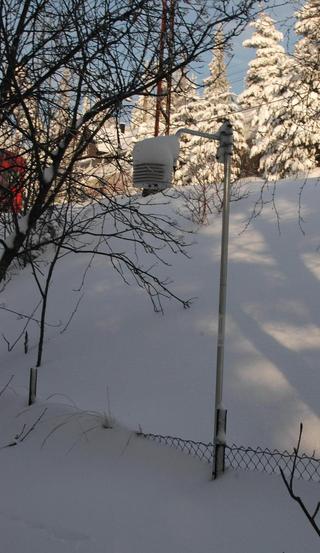
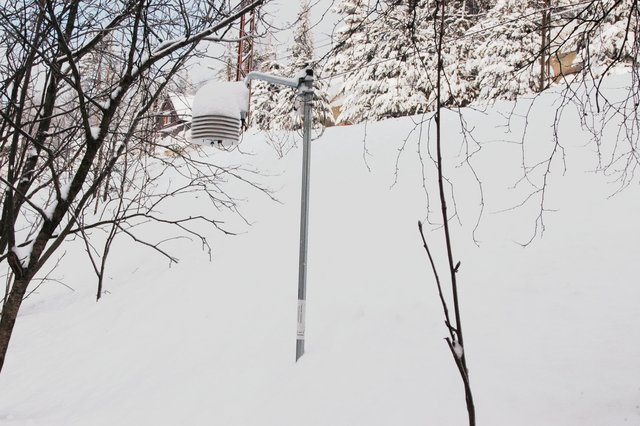
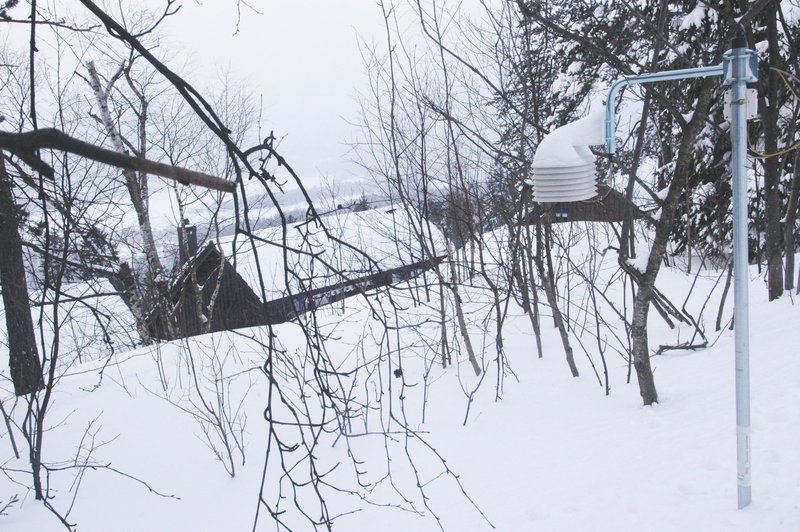
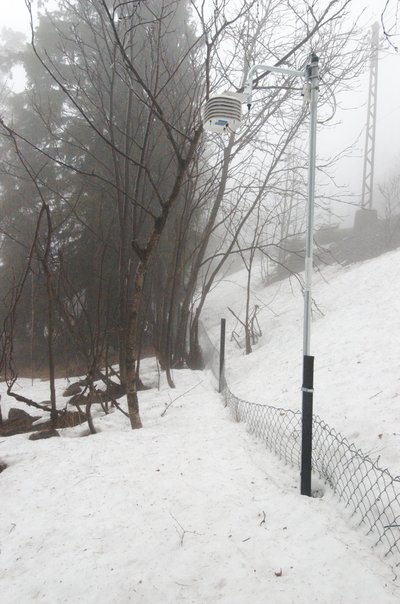
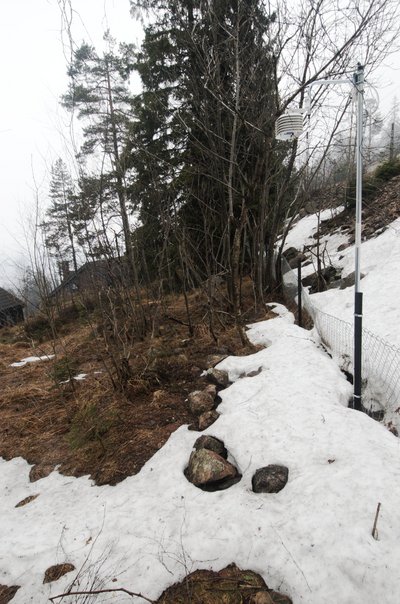
The site of the sensor.
|
|
In Voksenlia in northern Oslo 349 metres above sea level
the annual precipitation is more than 1000 mm, which means that there is a decent amount of snowfall during the winter; the snow cover is continuous usually from late November till late April. Snow depth monitoring may be of some general interest. Nearby at the same altitude is the Holmenkollen ski arena. Also close is the bus stop at Voksen Skog, which is another popular starting point for cross country skiers. Snow depth is currently already monitored in Oslo at Blindern (94 metres), Bjørnholt (360 metres) and Skullerud (175 metres). The greatest snow depth on record was 302 cm at Tryvasshøgda (514 metres above sea level) 2 km away from Voksenlia on the 8th April 1951. In winters like that the snow depth may be more than two metres even in Voksenlia, but in the typical winter the depth reaches around one metre. In the winter of 1951 there was still snow 200 cm deep 1 May at Tryvasshøgda, and the snow covered the ground from 29 October till 27 May. From 17 December to 10 May there was 100 cm or more. The winter of 2004-2005 had the least snow on record. At Bjørnholt (360 metres) all of February passed with depths less than 25 cm, which had never happened before since the observations begun in 1897. It was also snow free in mid January, despite that the November bore signs of a snow rich season; a depth of 45 cm was recorded 27 November 2004 (about as much snow as on the same day in 1950), and that, quite unlike 1950/1951, even became the greatest depth that season!
The snow depth is usually measured manually by means of a rod. I've wanted to automate the monitoring and still get a precision at
least as good as it would be if done manually. There are at least two ways to approach this: either by ultrasonic sensing (echo sensing) or by (infrared) light (using triangulation). A drawback using ultrasonic sensing is that the temperature also has to be monitored, since the speed of sound isn't constant. The main problem using light, however, is that the light might not work in bright sunlight. I bought both kinds of sensors and decided to try ultrasonics first, because the available sensors had a better range so that just one would suffice. If the sensor works well, the overall design would be simpler.
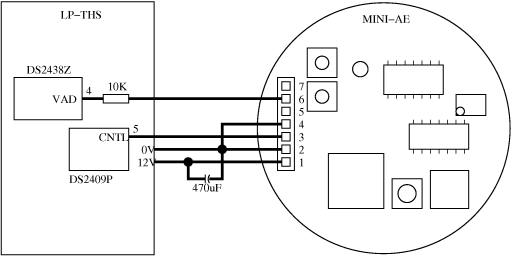
I bought the Mini-AE from SensComp, which seemed to be precisely the stuff which I needed. According to the datasheet the sensor gives an analogue signal between 0 and 5V which is proportional to distance, with a range of 25 to 300 cm in a 15° angle. The signal is temperature compensated, which will simplify the design. In my case, however, the compensation could fairly easily have been done in software. The signal needs to be monitored digitally and for this task I chose to use the LP-THS from Springbok Electronics, which includes a DS2438 voltage monitor (0-10V) using a 10 bit
A/D converter. SensComp has a nice box which fits their sensor, and for the LP-THS I found a suitable box at my local electronics store.
I did the following to get the pieces work together: I used the same 12V power supply for both. According to the SensComp datasheet the sensor normally pulls 30mA, but will in short bursts of 500µs require 2A. In order to filter out these pulses I added a 470µF capacitor. I then connected the analogue output of the sensor to VAD on the DS2438 (through a 10K resistor). Normally the sensor will sample continuously at 10Hz, but it accepts an optional external trigger (TTL). So I used a signal in the LP-THS which triggers a led, as the external trigger. Now the sensor will become active only when the computer probes the LP-THS. I'll get the previous sample, though, but this is no problem if the samples are frequent. Snow depth doesn't change much from one minute to another, of course, but frequent sampling, as frequent as once every few second, greatly increases the precision.
I mounted this and an accurate DS18B20 temperature sensor
inside a pagoda
from Davis Instruments. Strictly speaking, the temperature sensor wasn't necessary since the Mini-AE does its own temperature compensation. I included it so I would have a reference in case the Mini-AE didn't do the compensation well. The pagoda offers radiation protection and proper ventilation needed for accurate temperature measurements. I cut orifices in it for the sensor and power connectors. I let the data cable (1-wire CAT5) exit through one of the ventilation slits. I mounted the pagoda at the end of a bar which in turn was mounted on a pole. The sensor needs to be at a distance away from the pole, so it doesn't get into the sensor's range. If the sensor is mounted 250 cm above ground, it needs to be at least 33 cm away from the pole. My bar makes sure it's twice that distance away.
Update 6 April 2007: It should be easy to couple any 1-wire board which has a DS2438 with the Mini-AE. A good choice is the solar sensor board from Hobby Boards. This board is very small and fits easily inside the Mini-AE case. The drawback is that there is no signal on this board which can be used to trigger the Mini-AE, so we're stuck with the Mini-AE's default frequency of 10 Hz. I've successfully built a distance sensor using the Mini-AE (20' and 10V version) and the solar sensor board in this way: Mini-AE pin 1 is connects to 12V, pin 2 to ground and pin 6 to VAD on the DS2438 on the solar sensor board. The solar sensor board was assembled without the photo diode. That's it! But you might still want to add that 470µF capacitor.
Update 10 April 2007: The use of CTNL on the DS2409 as an external trigger for the Mini-AE assumes that the bus on the LP-THS is being switched on and off, but the software may not do this if the LP-THS is the only board on the main bus. It may therefore be necessery to add another sensor to the main bus to be able to trigger the Mini-AE as I've suggested on this page.
Update 30 September 2007: It's possible to make the LP-THS fit into the Mini-AE enclosure by a bit of cutting. I've done so with a 20' and 10V version of the Mini-AE, which soon will be put into operation at a new site at Tranby in Lier. I plan to add another sensor of this kind for a station on the island of Tjøme, but the Mini-AE for that one isn't working properly and I might not be able to repair it or get a replacement in time for this season. Below is a picture of the new sensor. It could be powered through the RJ-45 connectors, but I prefer separate connectors.
The SensComp sensor has several potentiometers for calibration. I adjusted them so it gives 0V at about 25 cm and 7V at about 275 cm (this gives a range of 250 cm, which is sufficient in Oslo). I also set it for maximum sensitivity, because it will measure the distance to snow, which may absorb sounds well. Some indoor tests in stable temperature conditions demonstrated that I could achieve an accuracy of ±5 mm for the whole range. Inaccuracies are likely to increase in unstable temperature conditions, though. I also noticed that some foamy substances would barely echo even at maximum sensitivity. Therefore, the sensor ought to be mounted a bit lower than its maximum range so that missed echos can be detected and discarded.
Update 23 November 2007: The 20' version of the Mini-AE is more sensitive than the 10' version, so if the sensitivity is set to maximum, the sensor will occationally report the maximum snow depth. I had to set it to about 60-65%, which seems to eliminate the problem while it still is sufficiently sensitive for snow detection.
After a few weeks of testing I found and calibration I found that the relationships between real and measured distances were:
| True distance | Measured distance |
| 250.0 cm | 249.5 cm |
| 200.0 cm | 199.9 cm |
| 150.0 cm | 149.8 cm |
| 100.0 cm | 100.6 cm |
| 50.0 cm | 50.1 cm |
I regard this as sufficiently accurate and the
differences are too small to bother to do further testing to find ways
of doing precise compensations in software.
In September 2005 it was about time to do some field
tests of the sensor, when the snow was still one or two months away.
The sensor was mounted 238.3 cm above a smooth surface. The terrain
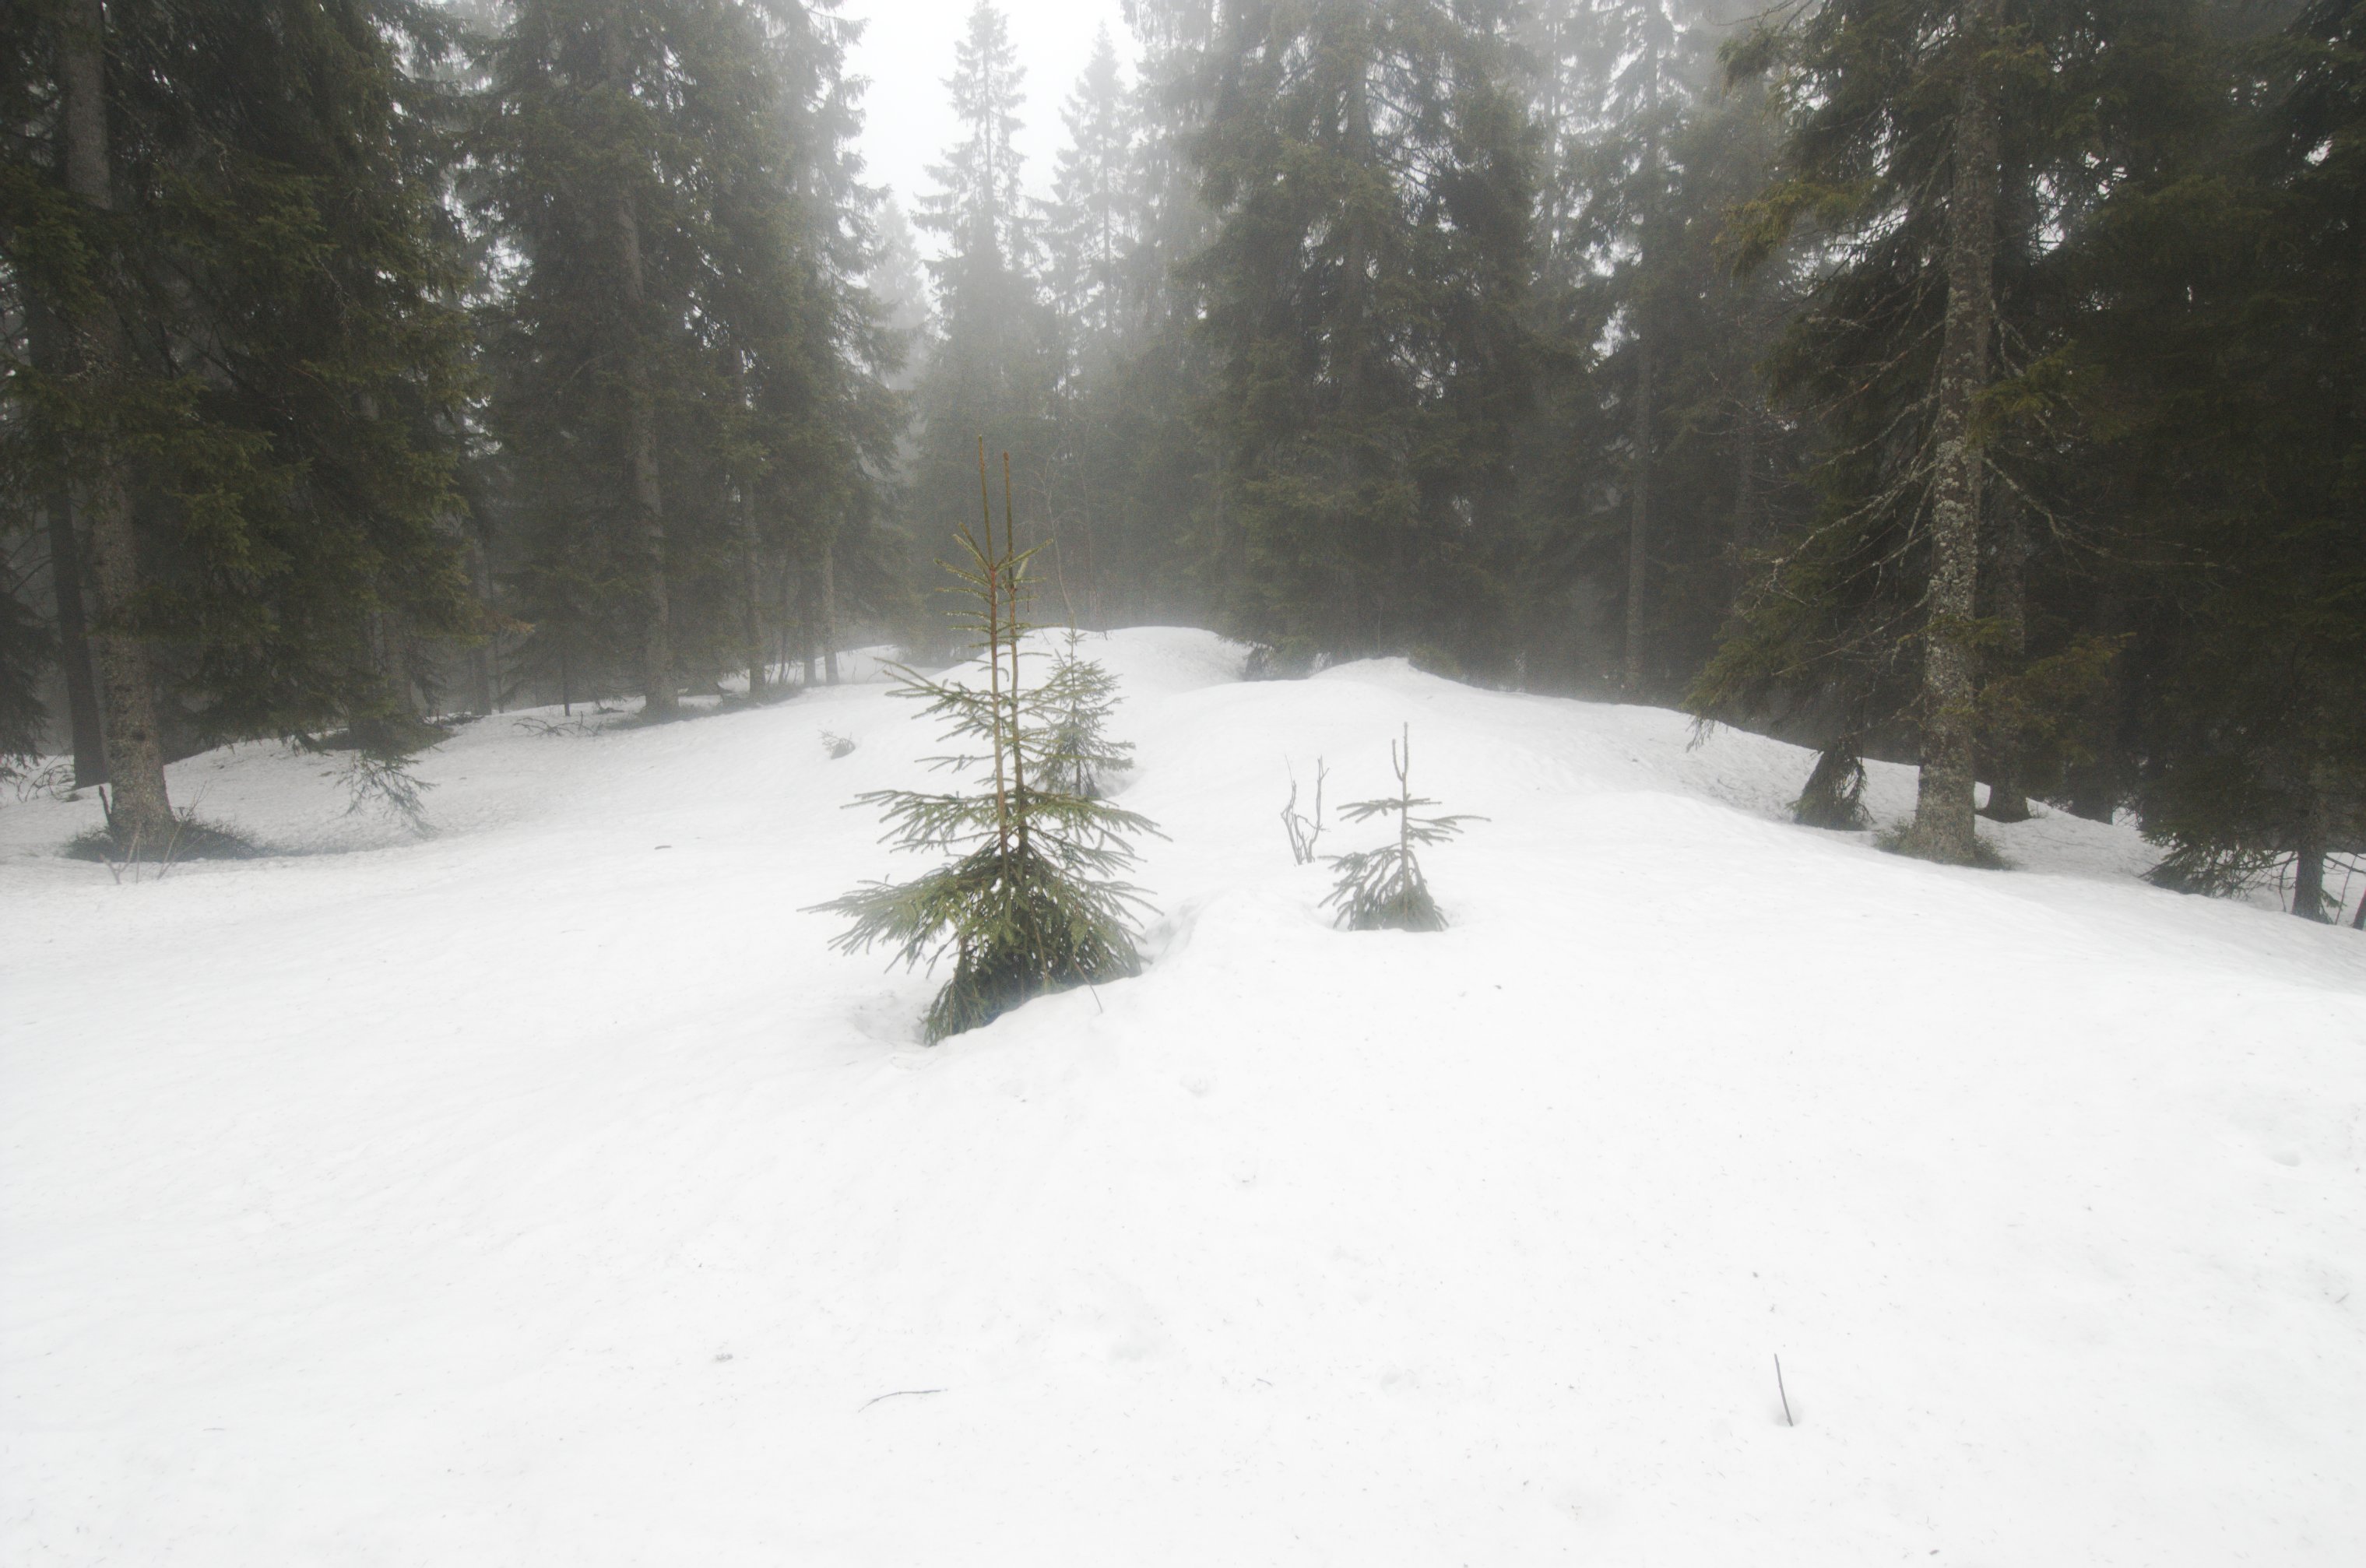
in Voksenlia is quite steep, about 30°, so the location of the sensor is more or less a shelf. It's located 349 metres above sea level in a somewhat forested area, and the place is pretty similar to much of ski track terrain near the city. However,
because the slope is facing the afternoon sun, the snow disappears
somewhat earlier (in mid April to late April) than in more shady parts of the forest.
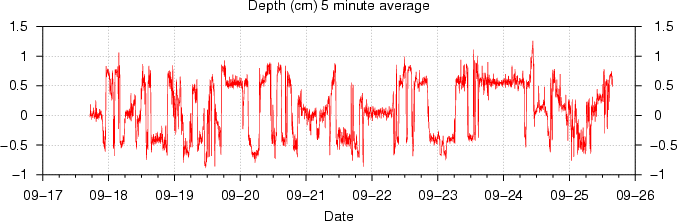
Even in changing temperature conditions, wind and
rain the level sensing was surprisingly stable, just ±1.2 cm using a 5
minute log interval, each of which consisting of about 100 individual
samples. These variations quickly drop with more extensive averaging.
False echos or absorbed echos seemed to be a non-existing problem with
no snow on the ground. Infrequent errors of this kind may easily be
corrected, anyway, by using filters or a suitable weighting between
means and medians.
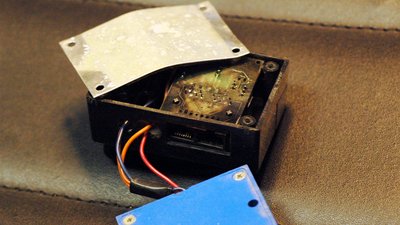
|
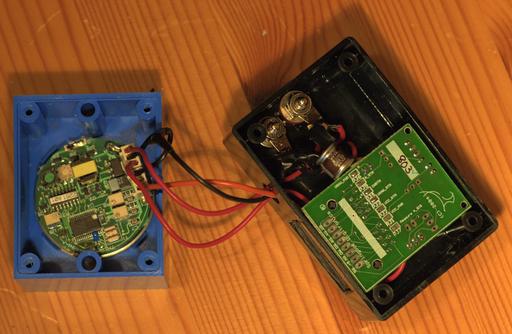
|
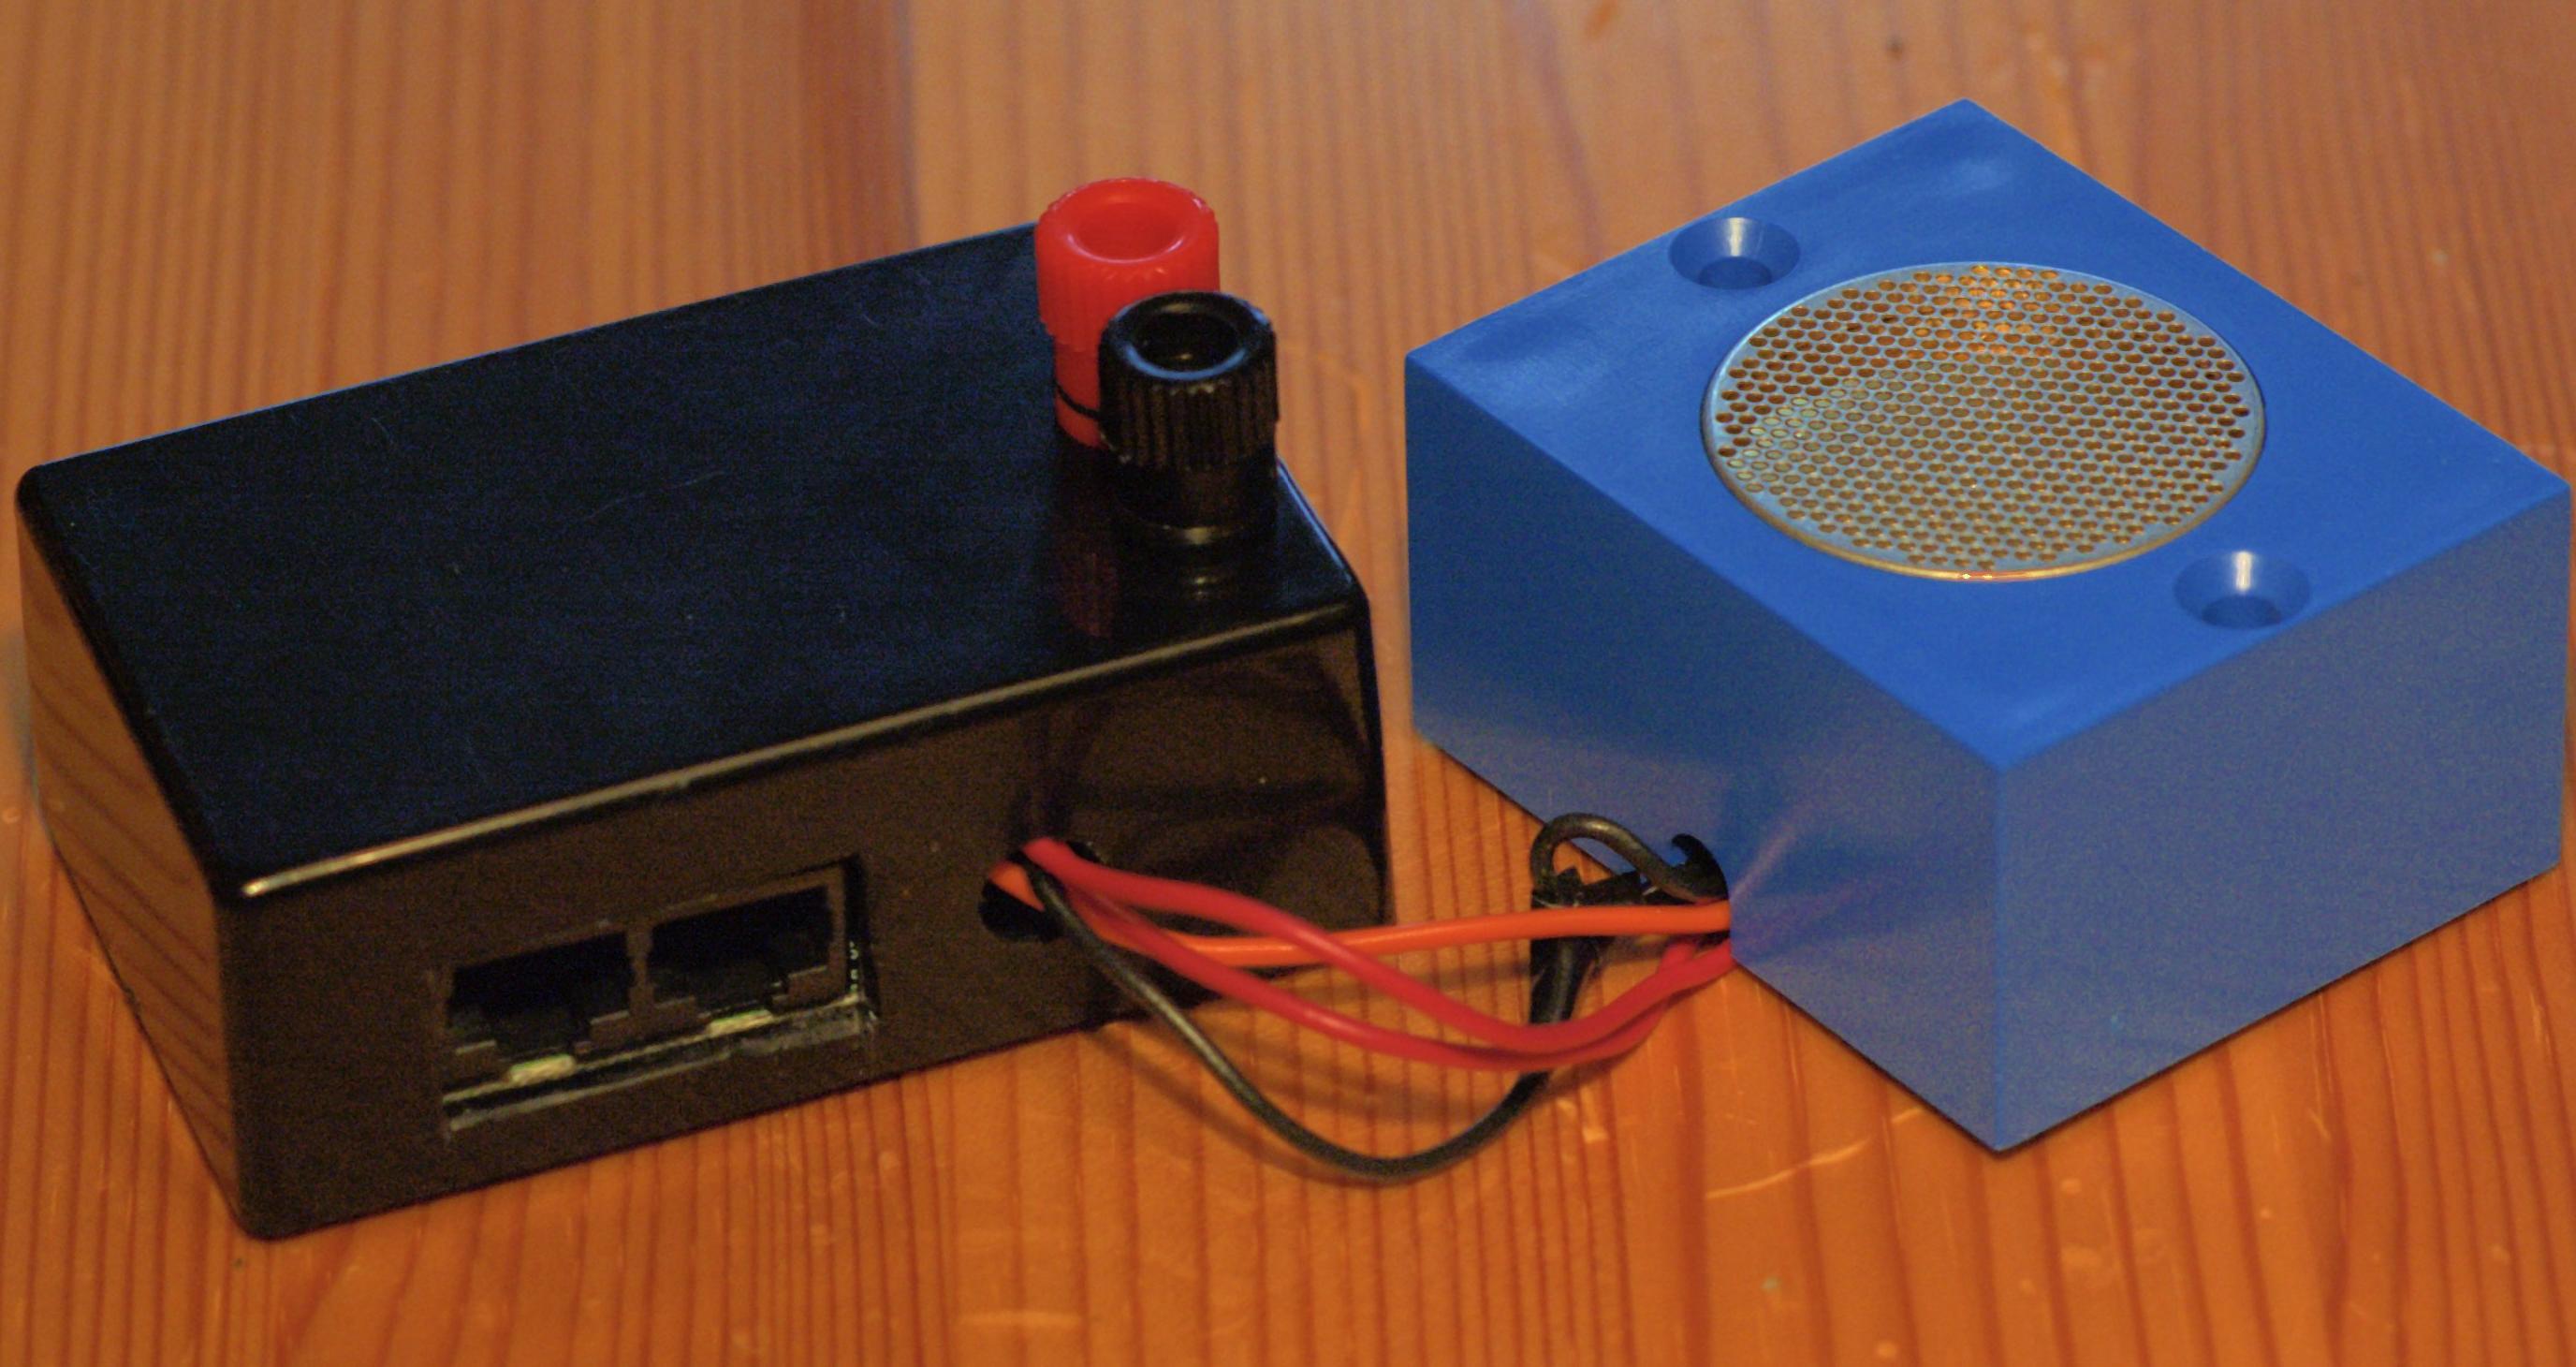
The electronics.
|
|
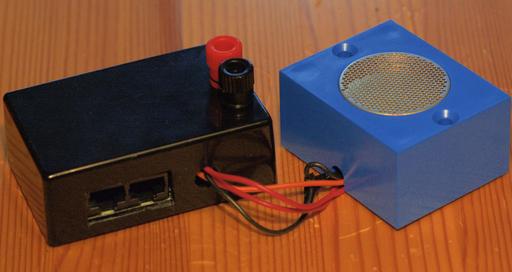
| |
Encased electronics.
|
|
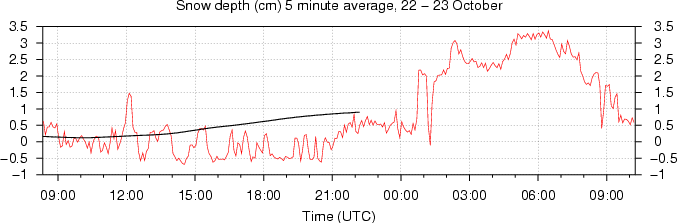
Update 22 October 2005
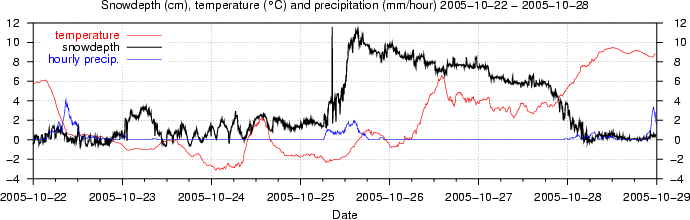
The sensor has now had its first experience with snow. About 9 mm of rain fell early in the morning of 22 October and the temperature was around +6 °C, but later on in the morning it dropped towards +0.5 °C, and when it had dropped below +1.0 °C, the rain turned into snow. The ground had no frost, it was wet, and the air temperature was still above 0 °C, so the snow didn't accumulate well. An additional 7 mm of precipitation fell (as snow), which resulted in just 1-2 cm of wet snow on the ground. The sensor didn't seem to detect this snow clearly; the samples were within the -0.5 to +1.5 cm range. That is, it seemed to indicate a snow depth of 0.5 cm. Clearly, the ultrasound was penetrating the snow and reflecting off the much denser ground below.
It was snowing densely at times, and the sensor showed no signs of receiving echos off the snowflakes.
In the evening the snowfall was very light at the temperature dropped to -1,0 °C. There was an additional 2 mm of precipitation and the snow depth increased to 4 cm. Now the sensor began to show 2-3 cm consistently. It seems that the new, thin, light layer of snow and the layer below which now had more ice in it became sufficient to reflect the sound.
During the next day as the air temperature approached 0 °C and the warm ground made the snow wetter, the snow became once again "transparent" and the sensor reported around 0.5 cm even though the depth still was 4-5 cm. It continued to snow lighly throught the day, but this snow was insignificant.
The first test shows that the sensor is able to measure the distance to snow, but also that the texture of the snow plays a part. This will be investigated further when more snow arrives.
|
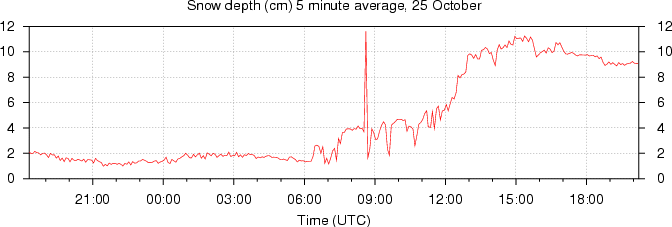
Update 25 October 2005
The sensor continued to measure a depth of 2 cm, whereas true depth was 3-4 cm. The next snowfall brought more snow than the first. It started as dry snow, the air temperature was -2 °C, and the sensor readings increased steadily, except that there was one spike from 4 cm to almost 12 cm and back again, which I cannot explain. Such spikes are easily removed by a filter, anyway. When 9 mm (water equivalent) of snow had fallen, the sensor reported 10-11 cm. I checked the depth manually and found it to be 11-12 cm depending on the exact spot. The precipitation was now turning into a mix of hail and drizzle bringing news of warmer air above, and the snow was getting wet. Shortly after the air temperature at the sensor site was above freezing.
The erratic behaviour seen during the first snowfall was gone. But the sensor still reported 1-2 cm less snow than what it actually was. If this is a regular pattern, a correction by adding 1.5 cm will work well.
The results from this snowfall were promising; the sensor seems to work well, but it frequently fails to report snow depths less than 4 cm, possibly because the echo from the ground below is too loud for the echo from the snow to be detected in a reliable manner. In that case, a foamy ground surface might help. Anyway, there are only a few days in a season when the snow depth is 4 cm or less, so it's not a great problem. Also, if I'm right about the cause, it should mainly be a problem with the first snow in the autumn, because when the last snow melts, it's much denser and will probably reflect better.
The weather forecast issued 25 October reports that there are several warm days ahead, so chances are good that this will provide me data for melting snow.
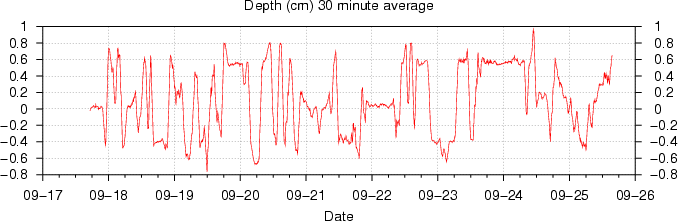
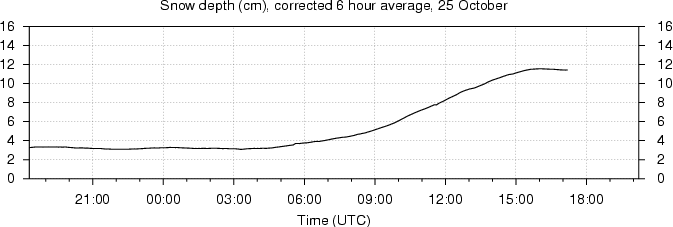
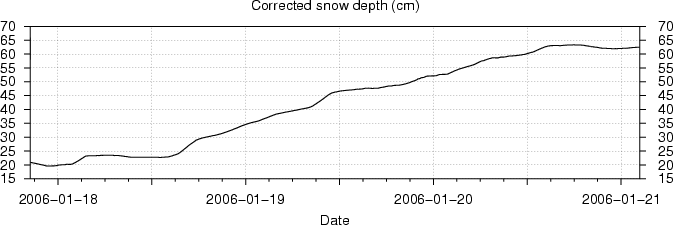
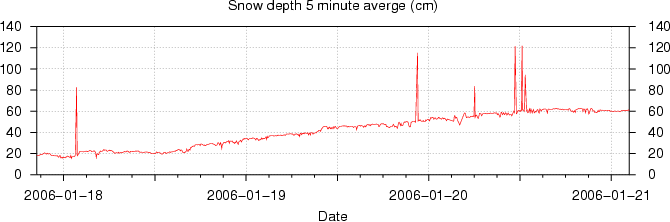
The figures below show a graph of 5 minute means and a graph in which these have been averaged into six hour means and corrected for underreporting.
|
Update 29 October 2005
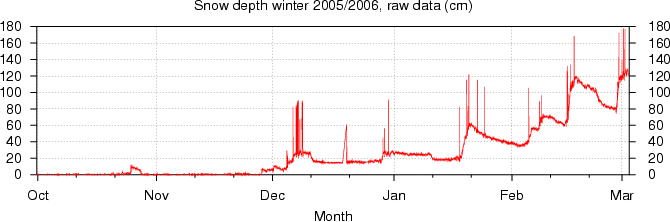
Very warm air arrived as forecasted and the snow melted quickly; it was gone so quickly that I was unable to get a manual reading of the last snow. Anyway, there was snow on the ground for six days which gave sufficient data for some calibrations which hopefully also will be valid in the future when the winter returns. Below the corrected graph may be compared to the raw data.
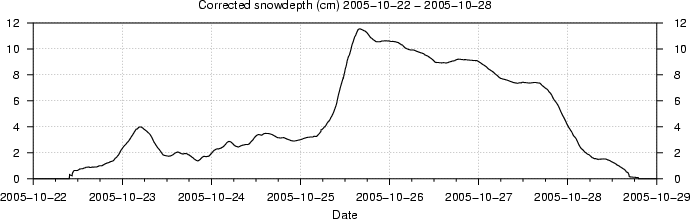
The corrections are as follows. First, the samples are avareged to a sliding 6 hour mean which removes the uncertainty of single samples. Because of the fluffiness of snow the ultrasound penetrates slightly into the snow, and consequently the sensor misses the true snow depth by 1-2 cm when it's calibrated for the hard ground below. Also, occationally, if the
snow cover is less than 4 cm and there is little ice in the snow, the
echo from the ground below might be too loud for the echo from the
snow to be detected. Therefore, 1.5 cm are added to the readings, but to avoid that a snow free ground gets interpreted as 1.5 cm deep snow, the 1.5 cm shift is only done if the sensor gives uncorrected readings above 1.5 cm for at least one hour during the next 12 hours (if they exist yet) and at least another hour during the previous 18 hours. Repeated readings above 1.5 cm are a sure indication that there is a snow cover. This shift significantly increases the chances that a thin layer of snow, which otherwise not always is detected, is reported. The addition varies between 0 and 1.5 cm depending on how many hours a snow cover was detected during the two periodes. This still results in some underreporting when there is only a thin snow layer, which can be seen between the two snowfalls 22 and 25 October in the graph when there wes in fact a depth of 3-4 cm, whereas the graph only shows around 2 cm.
If the ground surface were made up of something with the same reflective properties of snow while it also was hard enough so that any weigth of snow on top of it wouldn't deform it (if such materials exist), the sensor could be calibrated for materials like this and no other adjustments ought to be necessary.
Update 28 November 2005
A long warm period followed. In fact, so warm that leaves were beginning to reappear on some trees. The winter returned 21 November, which brought wet snow on the ground. It measured only one or two centimeters, which the sensor detected correctly. Then there was a day of heavy rain, and the snow and ice melted. This was followed by a brief snowfall which left two or three centimeters of snow. This snow, however, was very light and the sensor failed to detect it. More snow fell gently and the depth increased to 8 cm, which was equivalent to only 2 mm of water. The sensor failed to detect it properly; it failed to get any echo at all, or it occationally detected a depth of 50 - 65 cm, which clearly indicated that it was picking up false echos, perhaps from nearby vegetation or the sensor mount.
I tried to pat the snow gently to make it more compact. This was sufficient. The sensor reported 6 cm (corrected as described in the previous update), which was quite correct. I decided to change the software so that rare echos in periods of many lost echos will be ignored. That is, only reproduceable results should be logged.
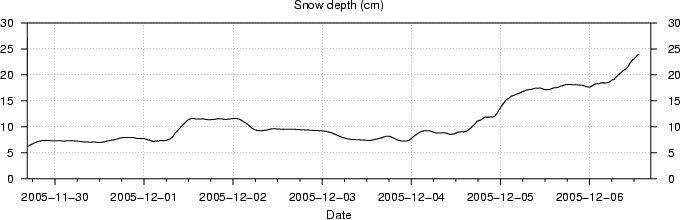
Update 6 December 2005
Most days during the following week have had some light snow. I checked the depth manually a couple of places beneath the sensor and found it to be 24.0 and 24.5 cm. The sensor reported 25.0 cm. This difference is acceptable.
The week brought more of the cases when the sensor had failed to detect an echo or it had detected false echos. It happens when the surface is made up of recently fallen dry and very light snow. I changed the software so that it now uses a mix of median values and averages, which so far has removed all clearly incorrect readings. The graph below shows the variations in the snow depth through 7 days. The incorrect readings have been removed by the software. The temperature was quite stable throughout the period, between -5.3 and 0.0 °C. Precipitation 15.6 mm.
Update 30 December 2005
In the early morning of 29 December there was very little wind, the temperature was about -10 °C, and some snow was falling gently. This gave 7-8 cm of snow, which should most accurately be described as "air"; it was hardly worth to shovel because it kind of blew away every time I put my shovel into it. Hardly surprising, the sensor completely failed to detect this snow. In fact, it reported 1-2 cm less snow than the day before, probably because the new snow caused increased absorption and less accurate readings of the hard snow beneath. This event demonstrates well that ultrasound isn't suited to measure snow of this kind. However, such conditions are rarely lasting, and in many ways it may be misleading to speak of an increased snow depth when the new snow has this quality and near zero water content.
It seems increasingly clear to me that if one wishes to measure new snow accurately by the minute or hour, it is better to use IR than to use ultrasound, but ultrasound is very good at measuring the total snow depth throughout a long winter if it's ok to get measurements of fresh snow not before it's settled a bit (usually within some hours, very occationally days). I think I will stick to ultrasound for the next season, but consider IR to measure new snow as a supplement to what I can measure today.
Later in the day the wind began to blow and it started to snow again. It was still relatively cold, -7 °C, but wind and drifting snow changed the quality of the snow; snowflakes are torn apart and turn into tiny ice crystals, which reflect sound well. The sensor reported the correct depth again.
|
The sensor reported 63 cm, which agreed well with manual measurements taken right below the sensor (61 - 66 cm). However, the depth was 78 cm near the pole. The height of the fence near the pole is about 97 cm.
|
Update 21 January 2006
The first snowfall of any significance this winter left behind about 50 cm of new snow. The sensor reported an increase in depth from 20 cm to 63 cm. Two manual measurements right below the sensor showed that the true depths were 61 and 66 cm, which indicated that the sensor was still working as it should. However, the variations in depth were great; I measured the depth at several spots within 10 metres of the sensor and found depths between 45 and 86 cm. There were also some small drifts whose depths were probably more than 100 cm. The sensor seems to be above a spot which is near the average of the area. Still, the depth at this spot seemed to be 10-20 cm less than the areas right next to it. The depth near the mounting pole just half a meter away was 78 cm. It is possible that the sensor itself or trees around it reduce the amount of snow reaching the ground. In that case, this will depend on the direction of the wind and if there had been a different wind direction, the snow would have accumulated differently.
Even though it actually wasn't windy at all during the snowfall, the depths did indeed vary a lot. Depending on the spot of the measurement, the amount of new snow may have been anything from 25 to 100 cm. The water content of the snow was very low, due to the low temperatures during the period when the snow was falling, -8 to -10 °C.
The sensor rarely reported the depth incorrectly throughout the snowfull in spite of the low water content. There were a few readings that were too high and there were also a few periods of half an hour during which the sensor failed to detect any surface. These errors are gone in the corrected graph.
|
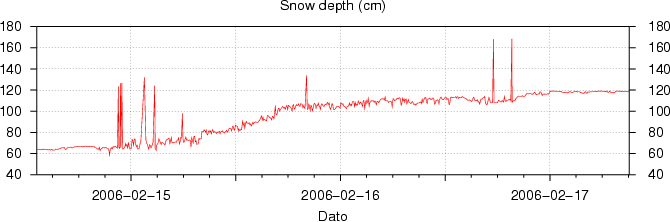
Update 17 February 2006
Another heavy snowfall dumped an additional 50 cm of snow over a period of two days, and the sensor was reading a depth of 119 cm. Most of it fell during the early hours of 16 February when a downward wind seemed to carry a lot of snow from the upper side of the hill. It can be seen now that the site of the sensor could be better. It's fairly close to a slope leading up to the metro railway above just 10 metres away, and the surface below the sensor wasn't horizontal anymore; the surface levelled out just below the sensor and some small lumps of snow have fallen down the slope above, and they've settled just next to the spot measured. I didn't make any manual measurements of the depth, but to get close to the sensor I had to wade in snow which in most places reached my waist, so a depth of 119 cm doesn't seem to be a much off; it seems to be a representative figure for the spots with the most snow. The variations in the area were still significant; some places the snow only reached my thighs.
Update 3 March 2006
The third great snowfall this winter left 50 - 60 cm of snow on cleared ground during a period of three days. It was, however, the first time the snow caused blizzard like conditions. The wind direction varied somewhat, but the wind was mainly northeastern. Despite the wind, the sensor seems to have been in a fairly well sheltered area. The snow had settled evenly and there were no drifts. The temperature was between -5 and -11 °C.
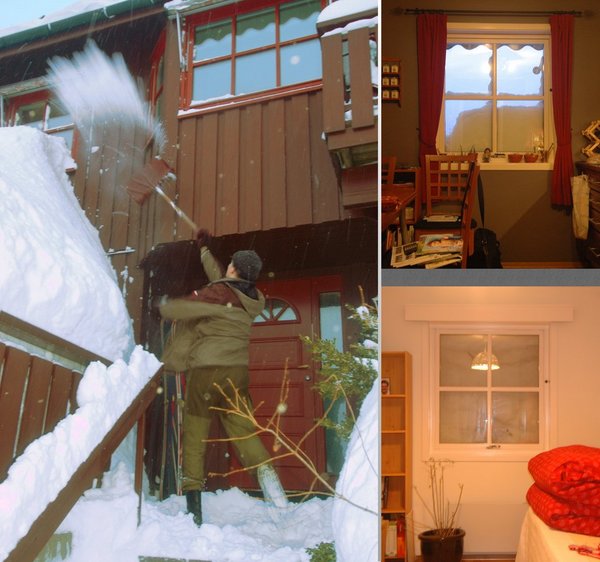
The sensor readings went from 81 to 129 cm. The snow surface was nearly horizontal, but there were two or three small lumps of snow beneath the sensor, which had rolled down from the banks of snow next to the nearby metro tracks. These lumps were unlikely to influence the readings this time, but again it's clear that the sensor should be located a bit further away from the metro tracks, so that snow from the banks wont roll down to the spot measured, which may happen when the snow depth is greater than the height of the fence (about 90 cm). It will probably suffice to move it 1 metre further away, unless there is more than 2 metres of snow (in which case the sensor will be buried anyway). The pictures below were taken 2 March.
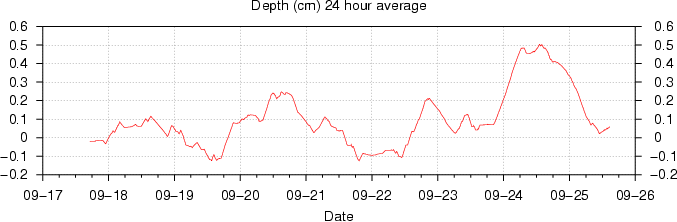
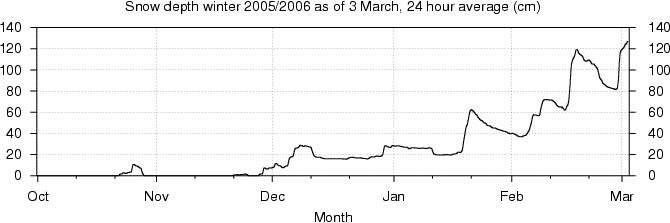
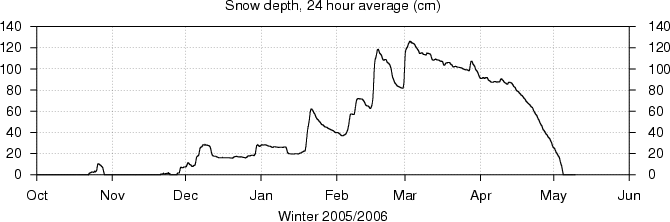
If we have a look at the data for the whole winter so far, we can see that the incorrect readings when the snow is very light are similar regardless of snow depth. They usually indicate a depth 60 cm too much. The graph showing the 24 hour average (after the incorrected readings have been removed) is smooth and clean, and clearly shows how the snow has compacted in periods without snow. Long periods of a stable snow depth indicate furthermore that the snow has been hard and icy. We can also see that the October snow melted quickly, and that the snow returned in late November and stayed, and that there was relatively little snow until mid January, whereas there was a great deal of snow after mid February.
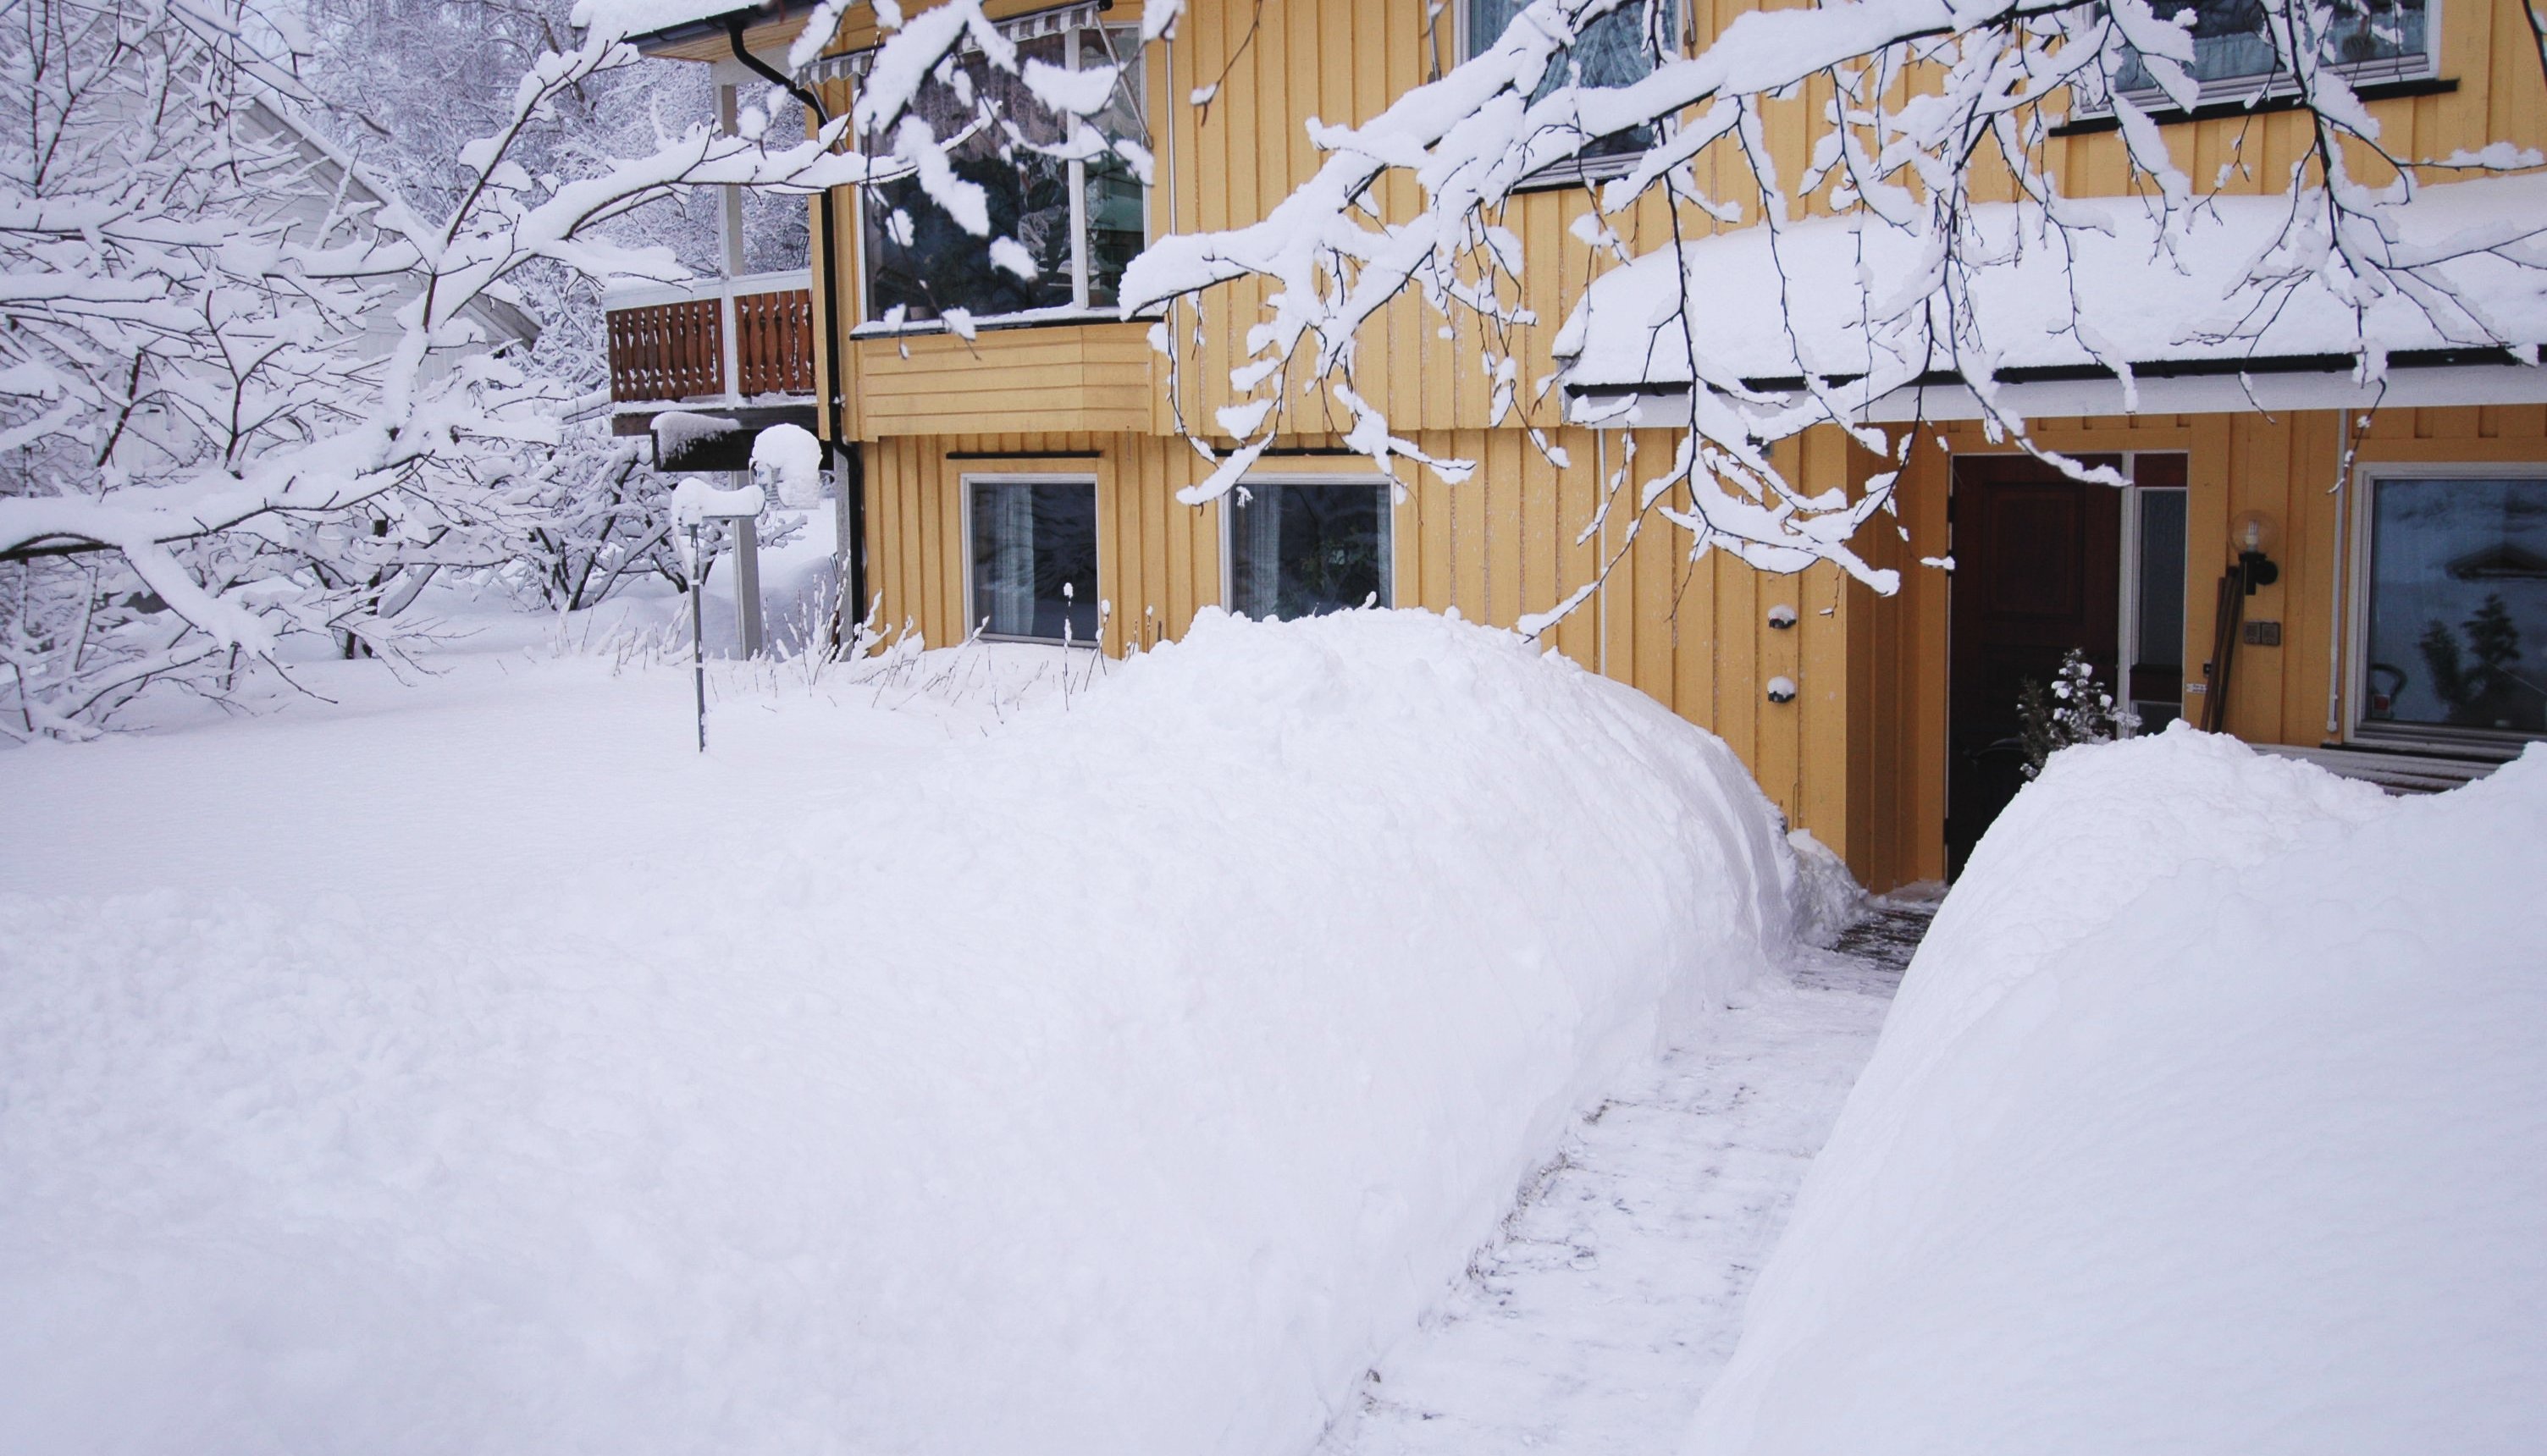
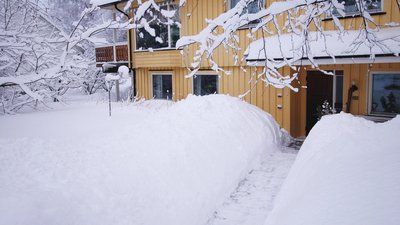
It's definitely more snow in the area now than in the average winter, as illustrated by the picture below. I'm running short of places to pile the snow. The view through a window in the ground floor was lost during the previous snowfall, and the view through the window in the floor above is now also beginning to disappear.
Update 10 March 2006
|
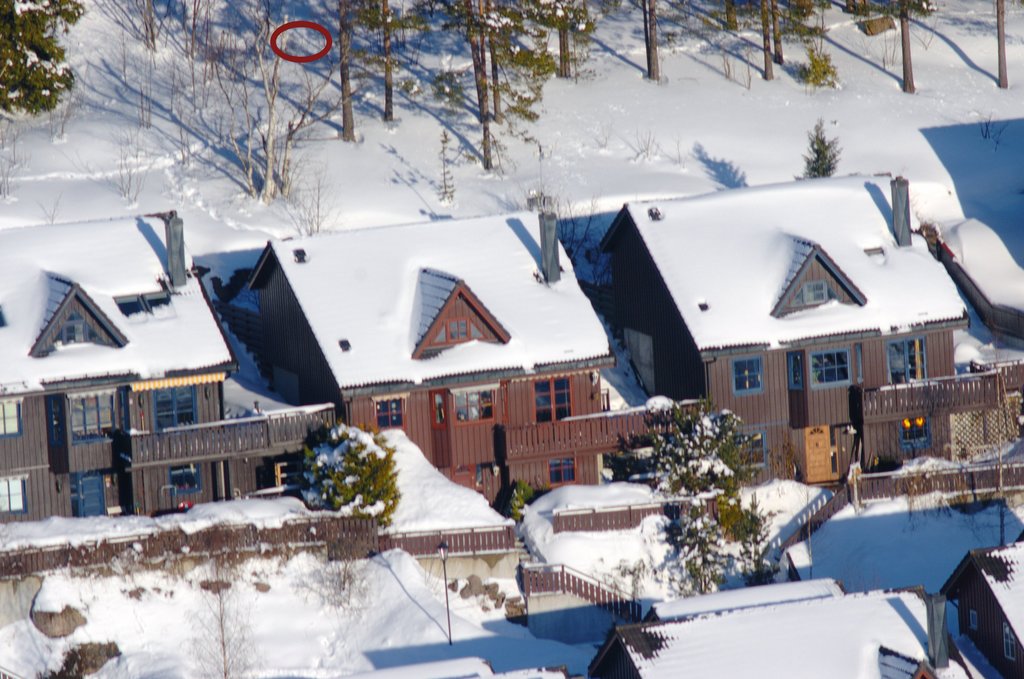
6-7 cm of fresh snow, which was very light because it fell in -10 °C and calm conditions, caused some problems. For two hours the sensor did not pick up any echos at all, and then it gave readings around 60 cm off for three or four hours. After this, however, the readings were correct again, but due to the high repeatability of the incorrect readings, they passed the filter and I had to remove incorrect entries in the log for the first time. The depth was about 115 cm, which means that the sound was travelling only half the distance compared to the distance at the beginning of the season, but this doesn't seem to help the sensitivity of the sensor.
To the right is a photo taken from a helicopter on 7 March, in which I've marked the measured spot with a red circle.
|

|
Update 9 April 2006
|
|
The melting season hasn't yet properly started. April started with some snow and sleet, temperatures near 0 °C and much fog, and this only seemed to make the snow heavier, while the depth was little changed. During the evening of 8 April 10 cm of snow fell, which made the surface undetectable for five hours. The snow was wet and heavy unlike the previous incidents, so it is not the water content that decides the reflectivity of the snow, but the structure. The snow fell as large flakes in calm conditions.
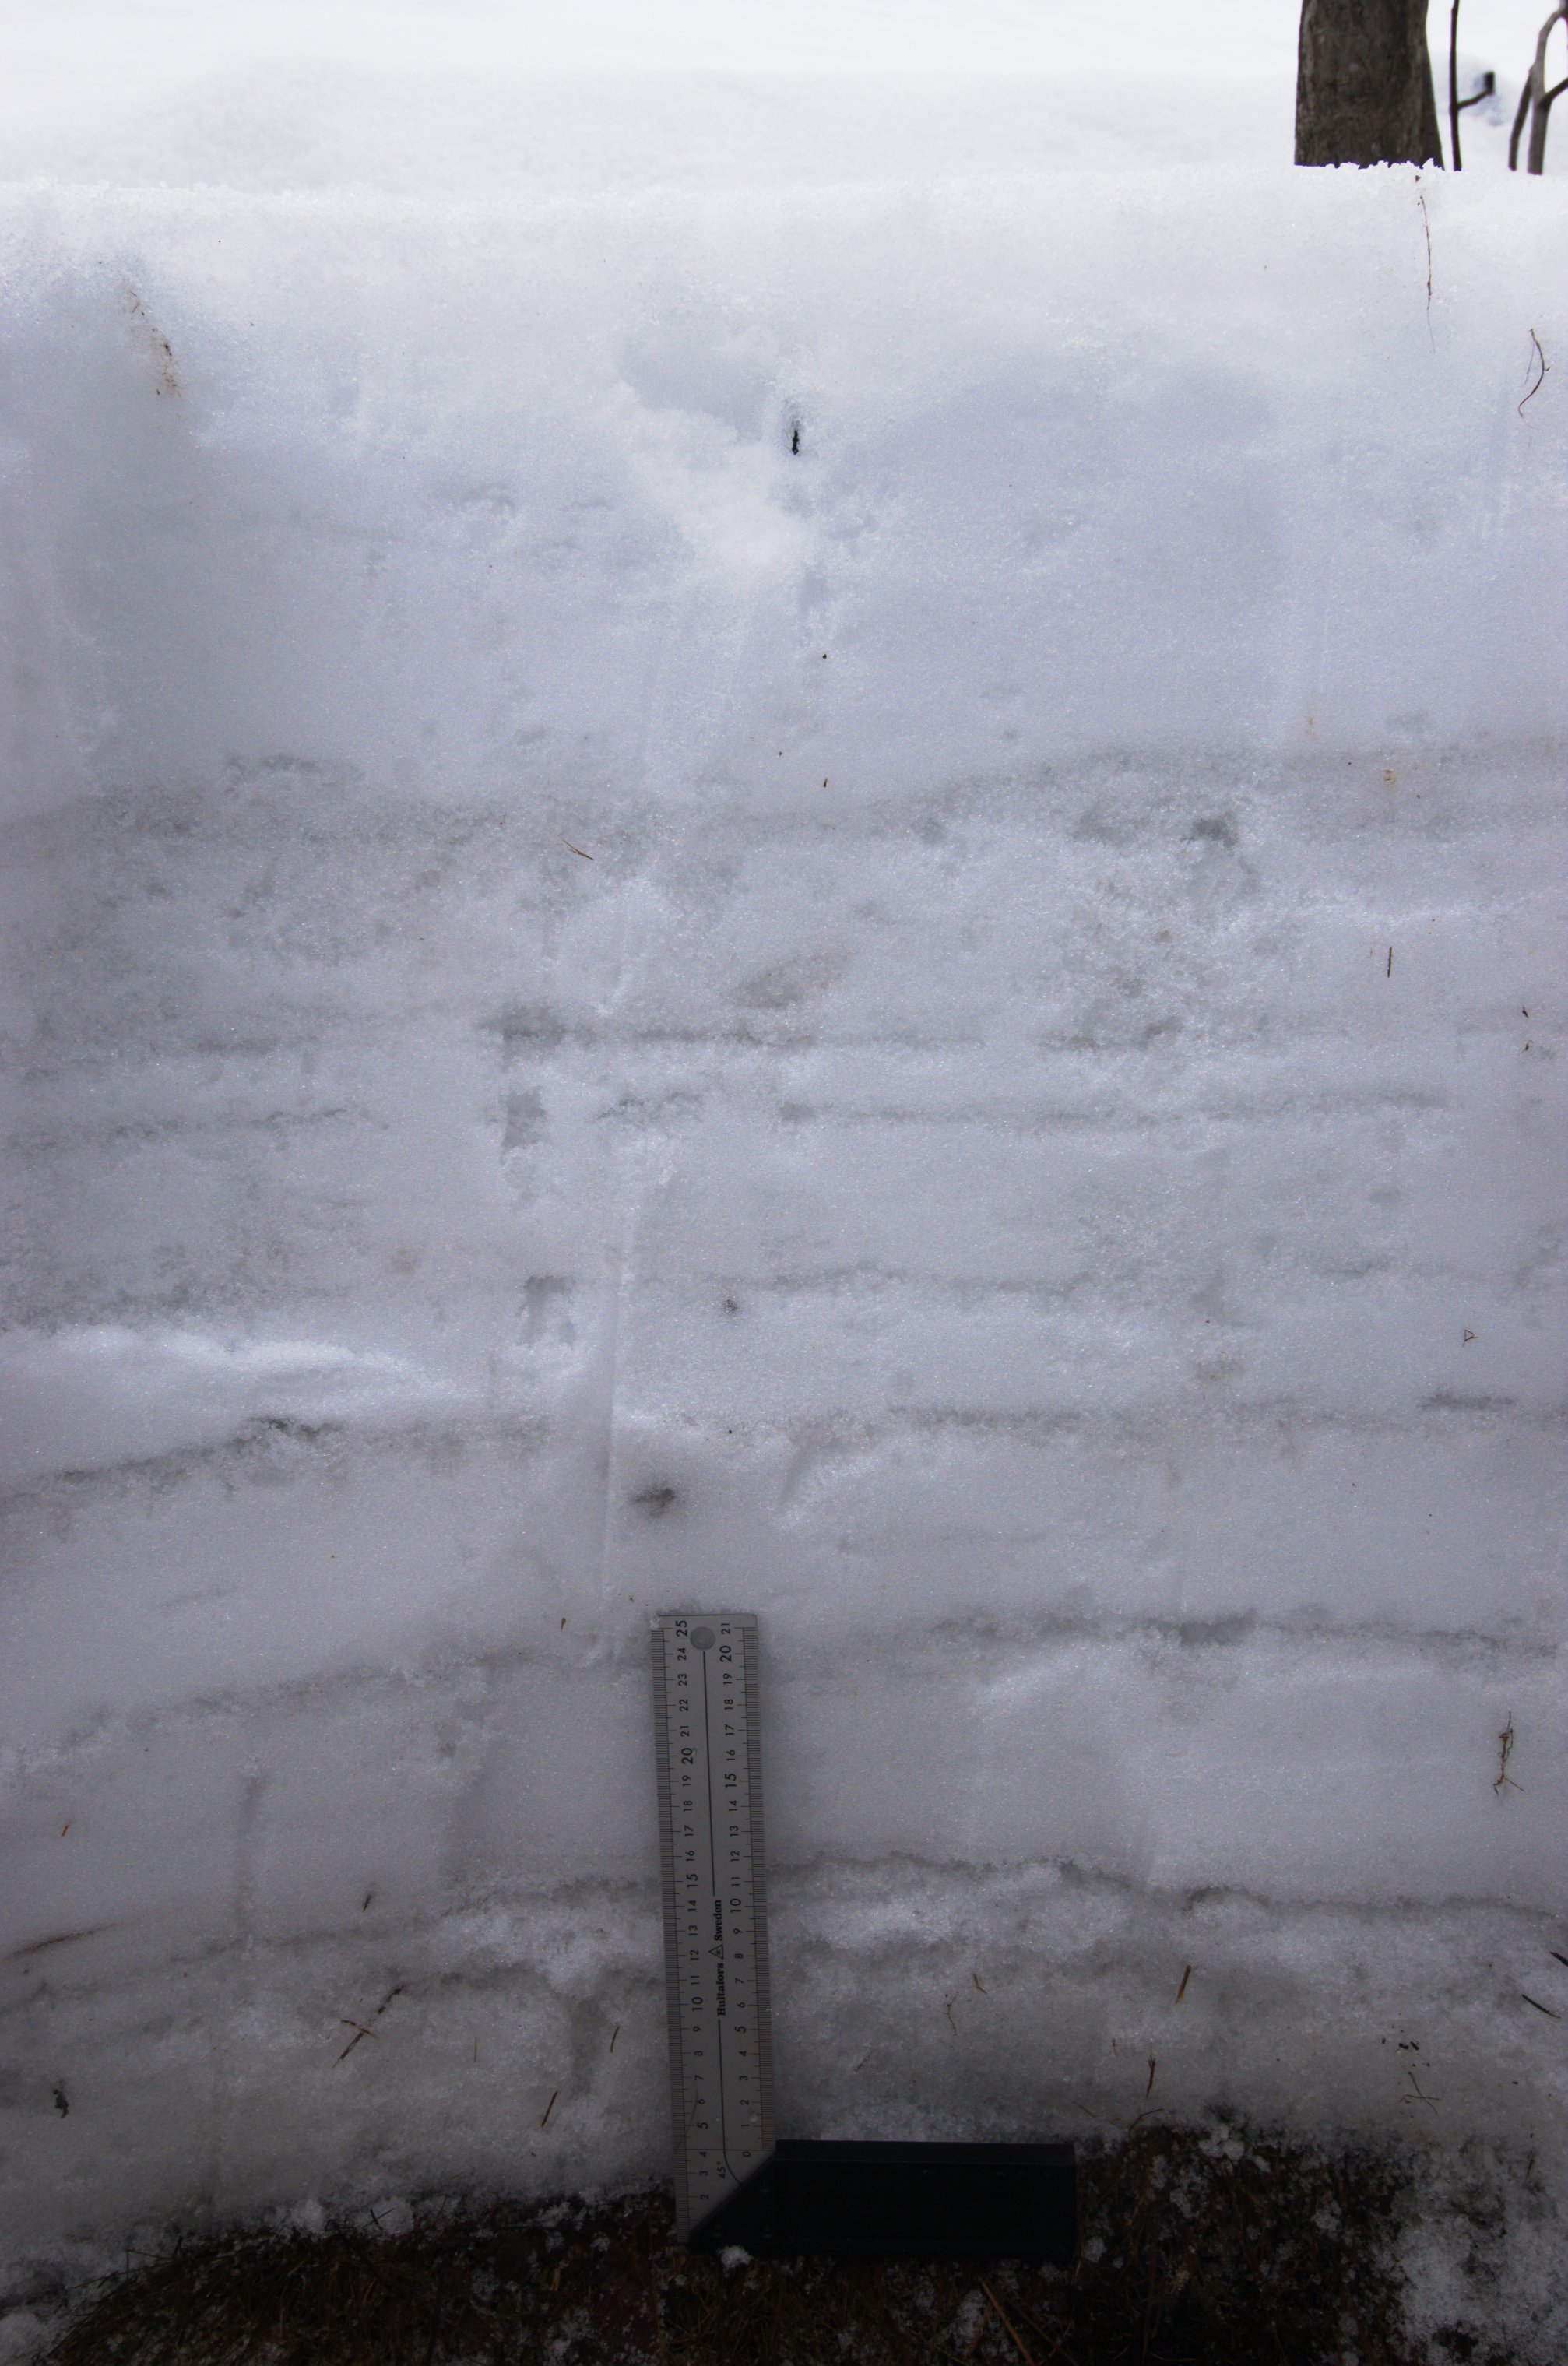
On 4 April I measured the water content in the upper 25 cm of the snow and in the next 25 cm below, and it was about 0.4 g/cm³ in both layers. The snow depth at this spot was 73 cm. The snow depth sensor was reporting 89 cm at the same time, but the sensor has more space and fewer trees around it, and that snow there probably has less water in it.
The water content is high and the snow might stay till early May unless there is a long warm period. There is no ground frost, so even if the warm weather remains elusive, the snow will slowly melt from the bottom upwards. The snow equals about 290 mm of precipitation. Since the snow arrived to stay in November, all precipitation has come as snow or sleet, except some insignificant drizzle.
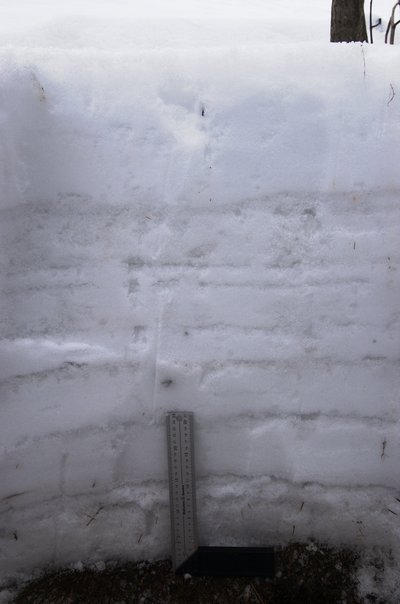
The picture to the left shows the intersection which I dug out to measure the water content. 8 clear layers of snow crust can be seen.
The picture below taken 9 April shows that the fence is about to emerge out of the snow, but there's still some distance to the ground. The snow depth was 93 cm. The tracks across the spot of measurement were made by birds, probably magpies.
|
Update 20 April 2006
|
The snow continued 12 April, but during the following night a few millimeters of rain fell. The temperature was just +1 °C and and the rain turned back to snow a couple of hours later, so the rain did not cause any melting. It's worth noting, however, that this was the first rainshower since the snow arrived to stay in November. 12 days into April the snow depth was little changed since the turn of the month, and it had been foggy almost 40% of that time.
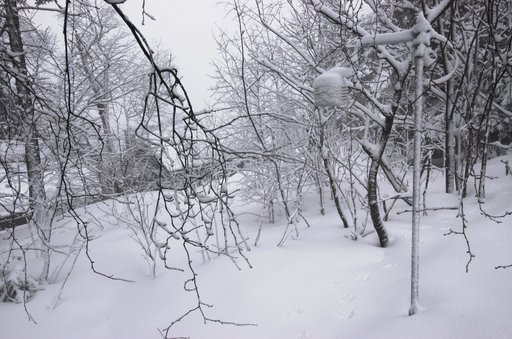
Then the snow melting finally got started: sunshine, daytime temperatures reaching +8 °C, morning temperatures around 0 °C. In the evening of 20 April (see picture to the right) the depth was 66 cm and the variations in the area were significant. Slopes facing the sun, bedrock and the ground below large trees were generally snow free. The deepest snow was to seen in the more open areas, like the location of the sensor.
The picture also shows the advantage of having a sensor which doesn't touch the snow instead of using a rod. A cavity forms around anything protuding from the snow as the snow melts.
This winter has been described as "a good old-fashioned winter", which probably means that it is like the winters of childhood the way memory later makes them: a winter that was mostly like a postcard and all precipitation between late November and early April was snow. Even in the old days most winters were hardly like this, but the winter of 2005/2006 does actually fit the description well.
|

|
Update 22 April 2006
|
|
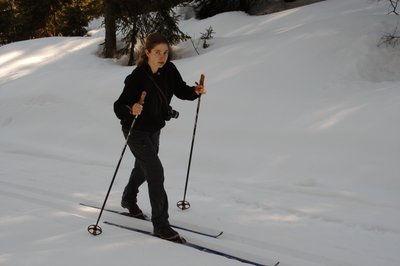
While cross-country skiing today I measured several snow depths in the nearby forest. Many sun facing slopes were snow free, but there was plenty of snow elsewhere. I measured in open, level areas. Near Strømsdammen (300 meters above sea level, 1 km away) depths were 40 - 75 cm. Near Skomakertjern (400 metres, 3 km away) the depths were 70 - 90 cm. And at Hyttli (450 metres, 2 km away) they were 60 - 80 cm.
The ski tracks were still excellent. The snow was icy in shady areas and soft in sunny areas. The temperature rose to +9 °C.
Skiforeningen reported 120 cm of snow in the Langtjern area (600 metres) near Oppkuven.
|
Update 26 April 2006
|
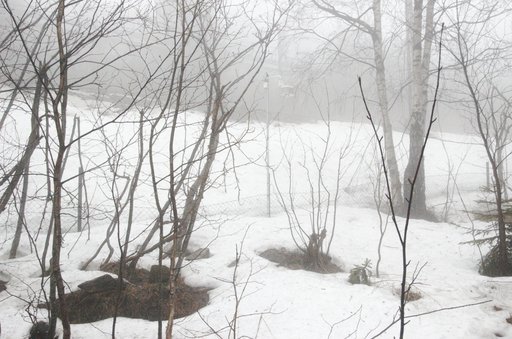
After several days without frost or any nightly radiation the snow was melting at a rate of 3-6 cm a day, and in the evening of 26 April 42 cm remained. There were several snow free areas in the nearby terrain.
It was drizzle, foggy and +6 °C when the pictures were taken. In the picture below some marks on the pole can be seen (click on the picture to get full resolution). These are marks for every 10 cm up to 100 cm, so the 50 cm mark is visible while the 40 cm mark is not.
|
|
Update 1 May 2006
|
|
On 1 May there were only some patches of snow left on the ground near the sensor, which was reading 25 cm. There were some showers of rain and sleet, and the temperature was +2 °C at noon. It was foggy a bit further uphill.
It was just enough snow this day to go skiing for the last time of the season starting from Voksen Skog. Skiing was possible at 300 meters above sea level, but the tracks were in a bad state, and there were many snow free areas in the nearby terrain. Above 450 meters, however, there was still plenty of snow, more than 50 cm at Hyttli, and there was even some fresh snow.
In the evening of 30 April, when the sensor was reporting 26 cm, I manually measured the depth below it. At different places I got readings between 23 and 27 cm.
The picture below shows the conditions on 1 May a bit further uphill. It's taken at Hyttli (about 450 meters) and the snow depth was about 65 cm. There was also some wet snow that had fallen in the morning.
|
Update 10 May 2006
The daily mean temperature increased by 15 °C during the first week of May, which greatly accellerated the melting. The snow below the sensor disappeared late 4 May. The last pile of snow on my lawn disappeared during 10 May. Since heavy snowfalls later than 10 May are very rare (the last time it happened was 14 May 1999), it should be safe now to sum up this season like this: Snow cover in the periods 22 October - 28 October and 21 November - 4 May (171 days), first snowfall 22 October, last 1 May (sleet), greatest snow depth 129 cm (3 March). The average snow depths for all season months were 1 cm (October), 1 cm (November), 18 cm (December), 34 cm (January), 77 cm (February), 109 cm (March), 72 cm (April), 2 cm (May).
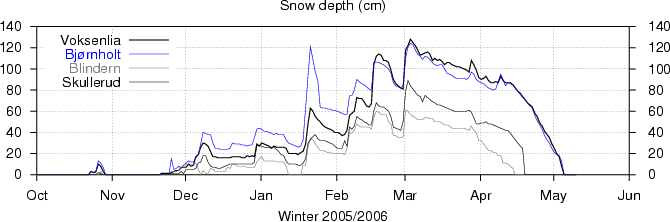
The graph for the whole season shows that the winter began with modest amounts of snow, whereas the late winter and the spring had plenty. The melting did not start until mid April. When the snow was gone, the sensor was again reporting 0 cm. That is, the calibration done in September was still valid, and we can assume that it was right throughout the winter.
The graphs below compare the measurements with data from nearby stations run by met.no. These are based on daily measurements taken 0600UTC. For comparable accuracy the data for Voksenlia are 6 hour means around 0600UTC. We can see that Voksenlia (349 meters above sea level) and Bjørnholt (360 meters) follow eachother fairly closely. The great peak in January at Bjørnholt is due to a snowfall which locally resulted in extremely light snow (more than one meter of fresh snow in two days some places) for a few days until it compacted. Skullerud is located at 175 meters and Blindern at 94 meters.
Update 28 August 2006
|
The sensor has been active all summer, but the ground beneath it got quickly overgrown, so the readings have been replaced by the correct depth of 0 cm. I've now cleared the area again and moved the sensor about 80 cm further away the fence and the slope behind it. It's now located about 2 metres away from the 30-40° slope. The previous winter showed that the snow covered slope moves sidewise at about the same rate as the snow depth changes (it touched the spot measured when the depth was at its peak at 129 cm), so today's location should be good for depths up to 2 metres.
The sensor is now 252 cm above ground and can measure depths up to 218 cm. Such depths are only seen about once a century. The sensor is mounted on a longer arm, making it more sensitive to vibration due to wind. However, since the readings get averaged, it's unlikely that it will affect the accuracy.
|

|
Update 2 April 2007
|
The ground beneat the sensor reappeared 2 April after a winter with very little snow. The greatest depth was only 48 cm.
The sensor has worked without any problems through another season, and it correctly measured 0 cm when the snow had gone.
The picture to the right was taken 31 March.
|

|
Update 2 June 2008
The sensor has recorded its third season without any problems. There was snow on the ground 22 November, from 24 November to 15 April and 17 May.
Update 16 August 2008
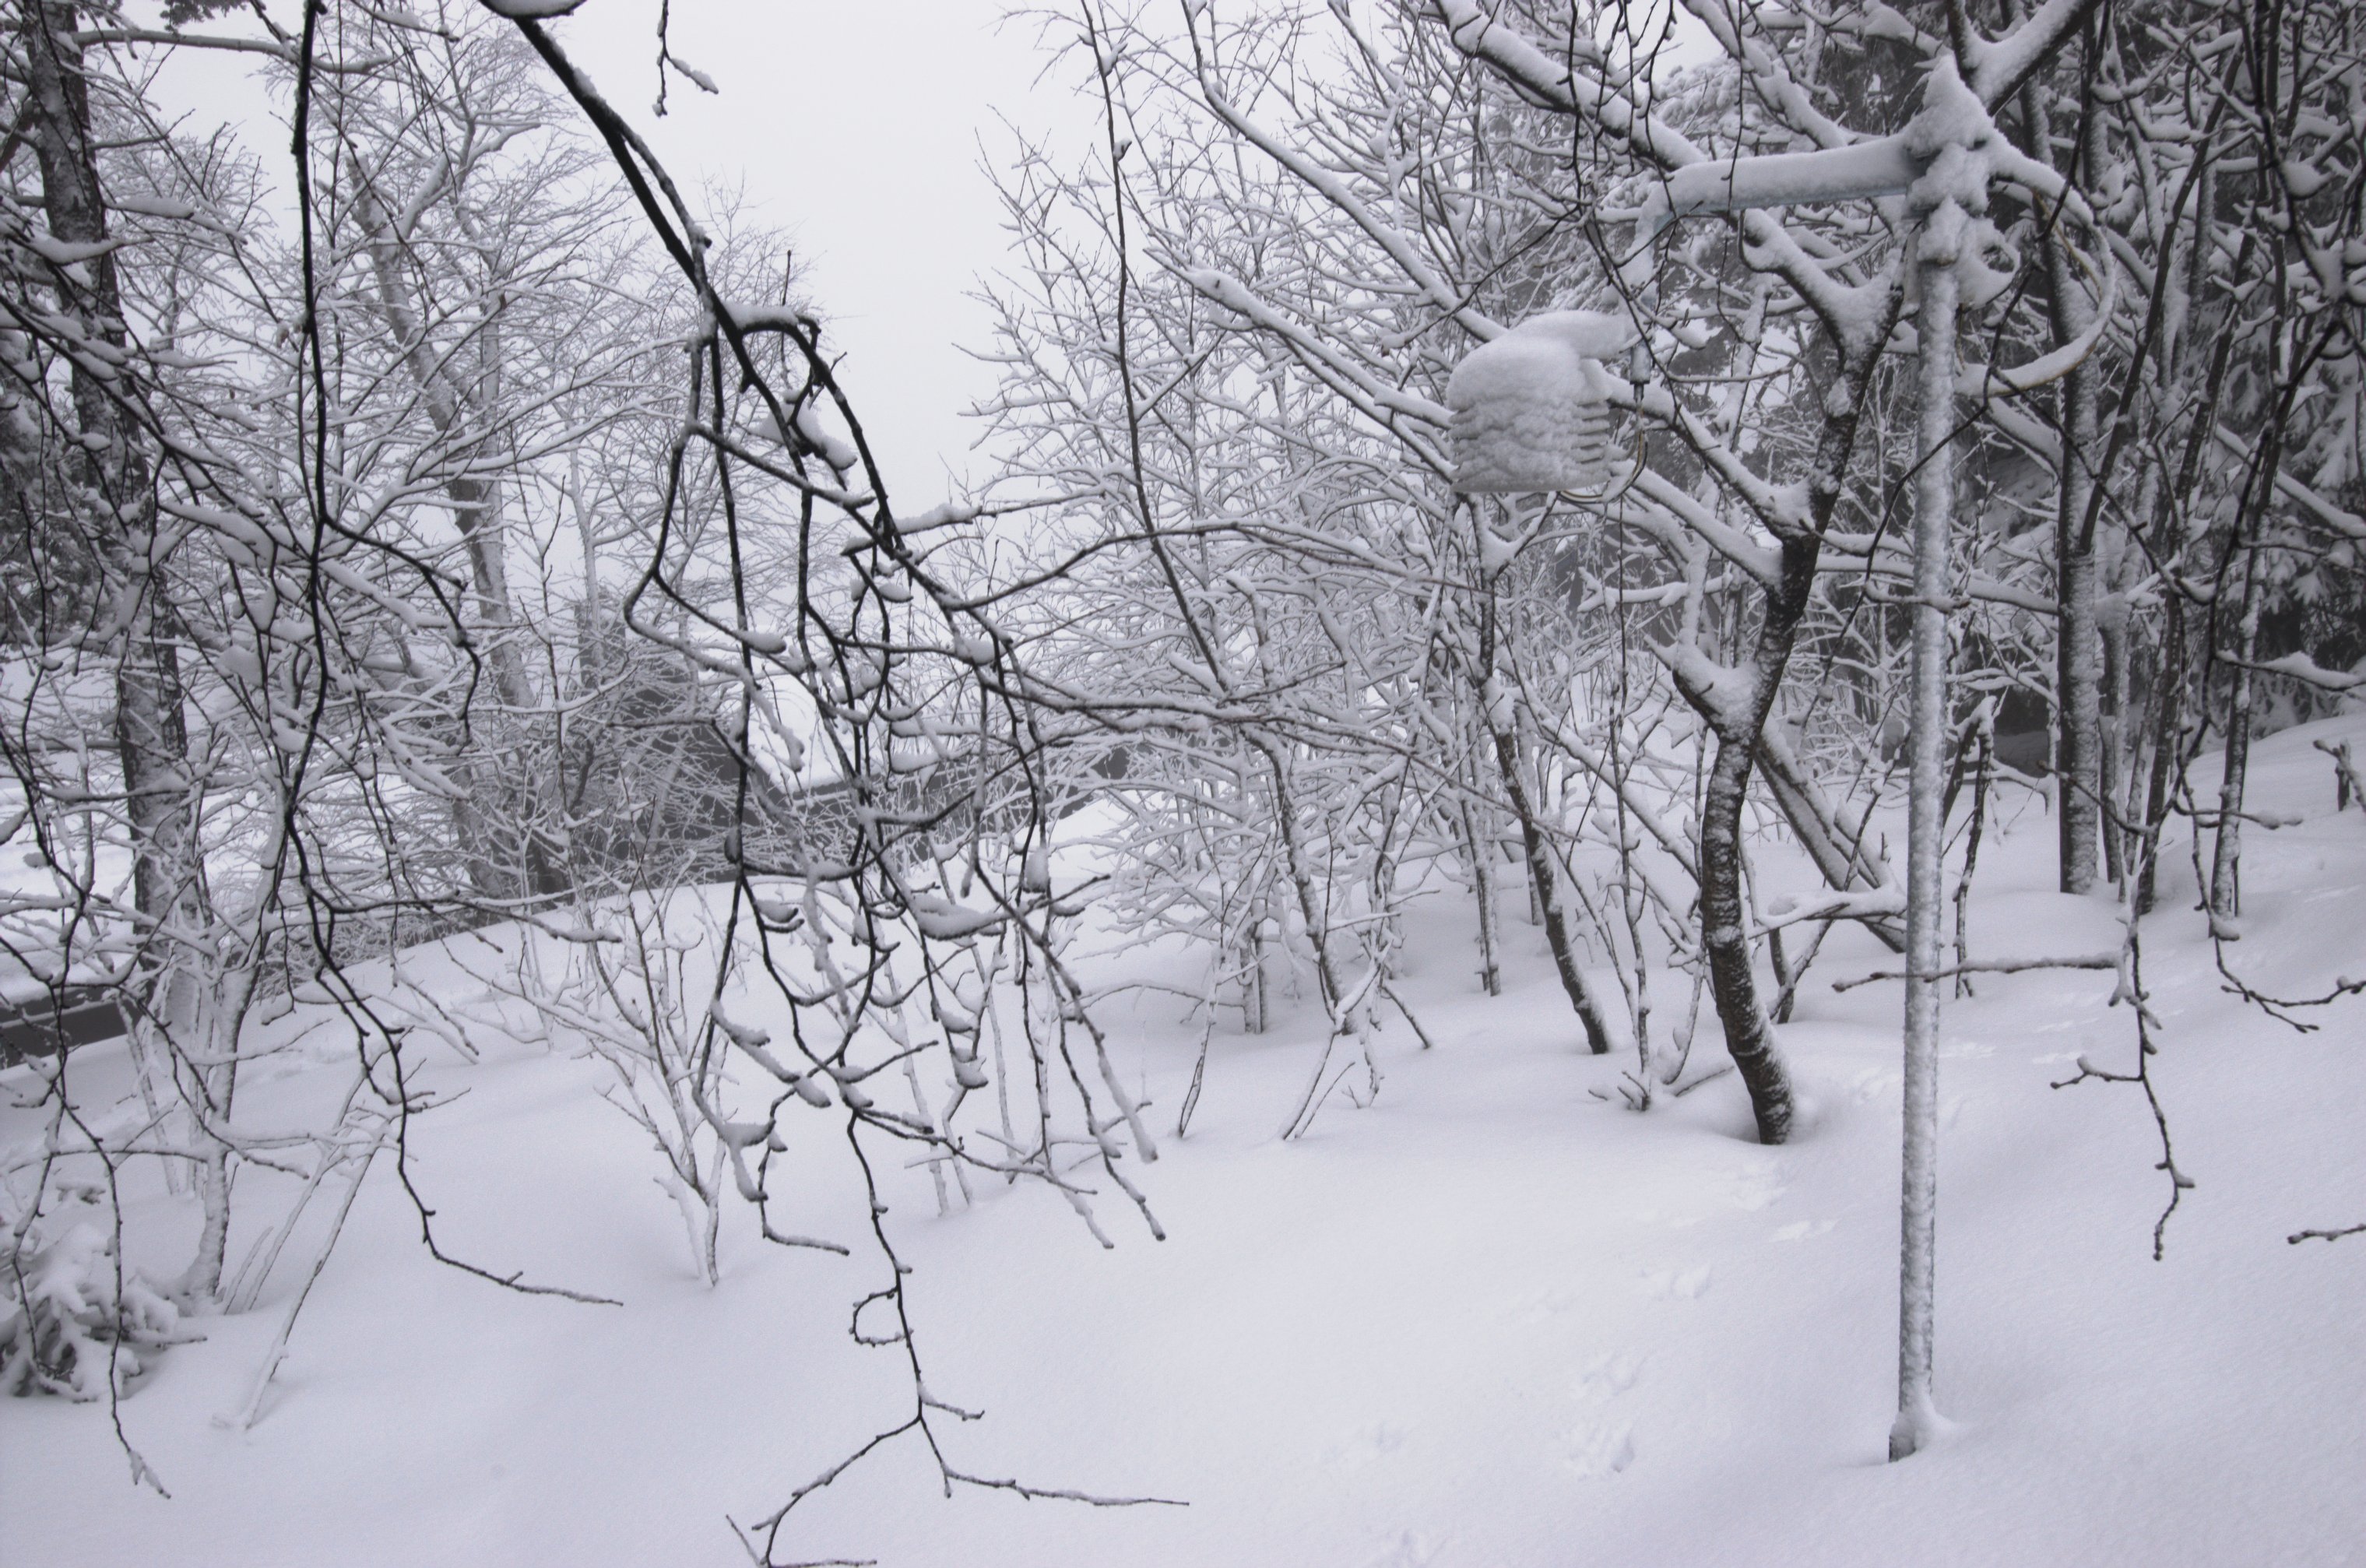
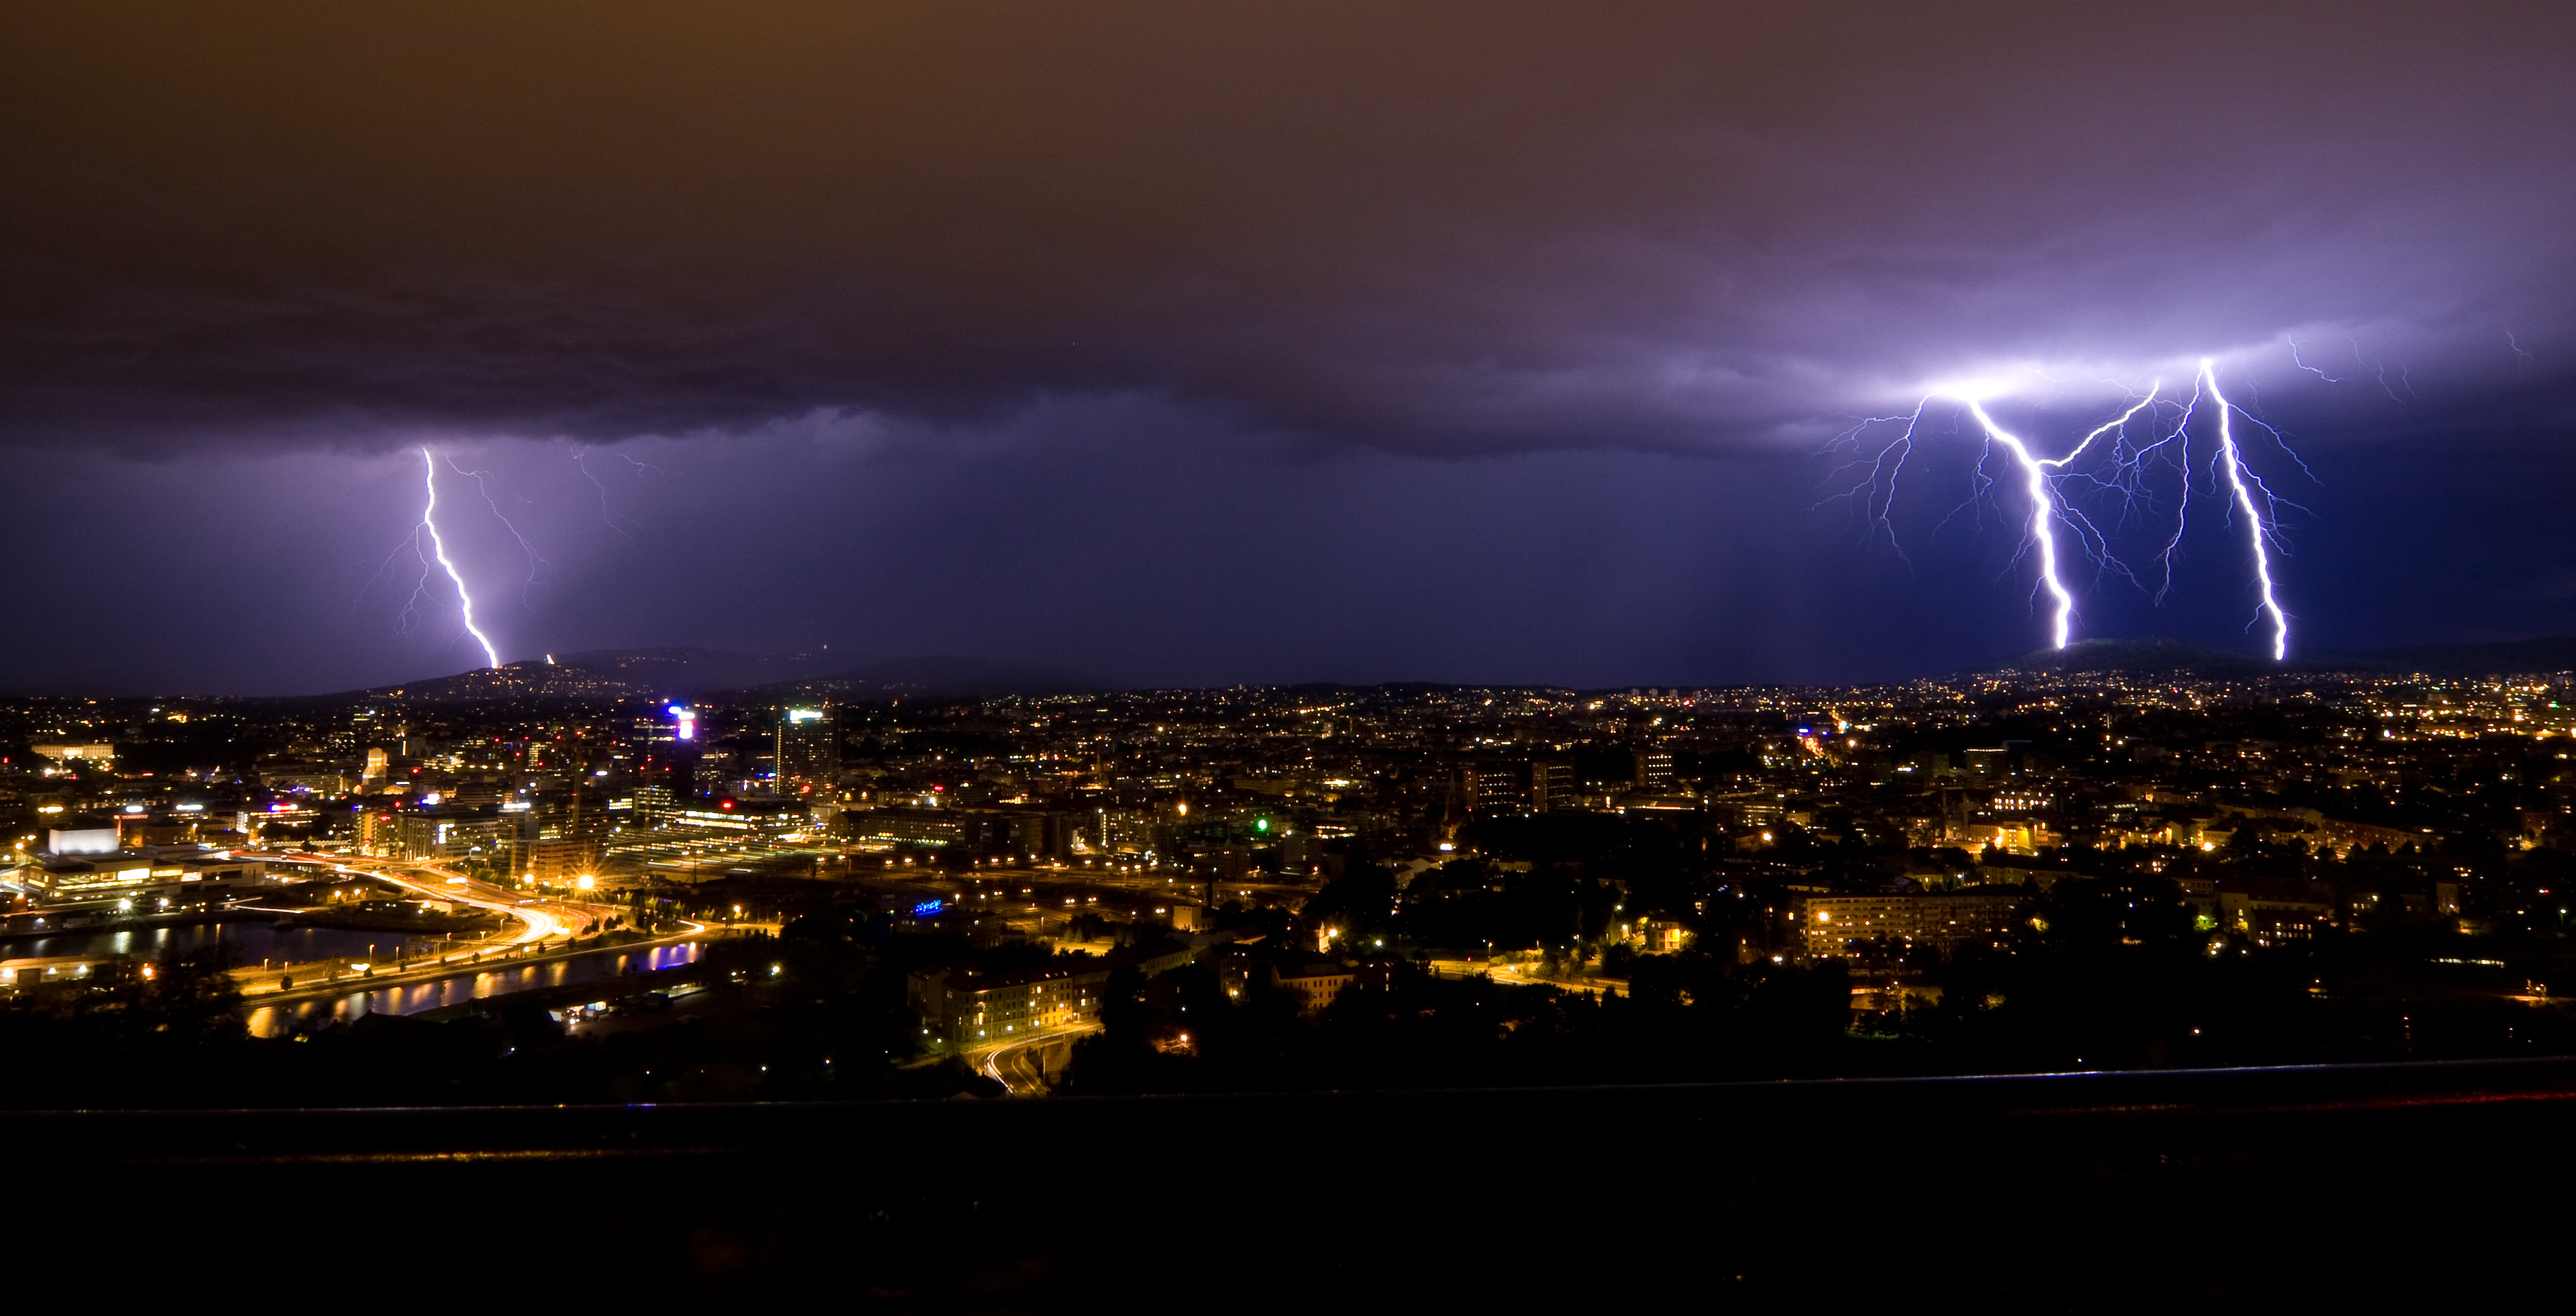
|
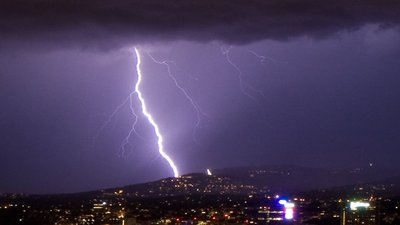
29th July at 22:49 a lightning struck and destroyed among other things the snow depth sensor. I tried to repair it, but every single circuit that I tested was dead, and I gave up. I originally built two sensors, so I've now installed the spare. The picture to the right was taken by Hans Aspenberg and shows the very lightning that struck.
| 
|
Update 25 January 2009
|
The sensor at Tranby is now in its second season. It works well. It's base on the newer 10V and 20' version of the Mini-AE and the accuracy seems slightly better compared to the 5V and 10' version used at Voksenlia. A lightning strike destroyed this sensor last summer and it was replaced with an identical spare.
The picture shows the sensor at Tranby 25 January 2009. The snow depth was 89 cm.
| 
|
Update 20 April 2009
The snow under the sensor has smelted. At the end of March it was still very wintery and it seemed likely that the snow would last until May, but April was warm from the beginning and the snow melted quickly. There was snow on the ground 28 October till 8 November, 13 November, 26 November and 29 November till 20 April - a total of 157 days (assuming no more snowfalls this season). The snow depth reached 94 cm 12 March.
Update 28 February 2009
I've made a new spare sensor since the old spare now is in use after the lightning strike last summer. While making the new sensor I discovered that I had written that Mini-AE pin 6 (output voltage) should be connected to DS2438Z pin 2, which is Vsens+. This pin is used to measure current, not voltage. I've corrected the text to pin 4, VAD.
Update 5 August 2011
|
On 29th July at 12:41, exactly three years after the previous big lightning strik, another lightning struck and as in 2008 it destroyed the snow depth sensor. Even though the sensor was mounted at the end of 1.5 meter arm on a 3 meter metal pole which in turn is deeply rooted in the ground, this wasn't suffient to lead the currents away from the sensor. Note the bent metal plate. Pretty strong forces have been at work!
There isn't much left to repair in this sensor, so I've replaced it with a spare, and I'll have to build another spare from scratch.
| 
|
Update 22 March 2012
More recent SensComp sensors apparently behave slightly differently. After having replaced the damaged instrument with a new one, I had a lot of trouble getting it to work properly. When the sensor was set for high sensitivity it gave mostly random readings above snow free ground or crusty snow. When set for low sensitivity it worked over snow free ground, but failed to get readings over fresh snow. I tried several sensors and all behaved the same way. After a while I found that if I tilted the sensor a bit, it would work. The problem seemed to be that an echo will bounce up and down between the ground and the instrument if the sensor points straight down. The larger the case used for the sensor, the greater the problem. So tilting it solved the problem, but later I covered the underside of the casing by plastic foam (leaving an opening for the sensor). That will absorb the sound and stop the echo. Foam with an uneven surface should work even better, since the sound that isn't absorved then would spread more. Using this foam the sensor can point vertically again.
Comparisons with data from DNMI/met.no
These are comparisons of data from Voksenlia (VL, 349 meters) with met.no's data at Bjørnholt in Nordmarka (BH, 360 meters), Blindern (BL, 94 meters) and Skullerud (SK, 175 meters) for the season 2005/2006, snow depths in centimeters, measured daily 0600UTC. Clearly incorrect data have been removed. "-" means snow cover observed, but the amount wasn't sufficient for detection. Spaces means no observation.
| Date | VL | BH | BL | SK |
| October | 1 | 1 | 0 | 0 |
| 1. October | 0 | 0 | | |
| 2. October | 0 | 0 | | |
| 3. October | 0 | 0 | | |
| 4. October | 0 | 0 | | |
| 5. October | 0 | 0 | | |
| 6. October | 0 | 0 | | |
| 7. October | 0 | 0 | | |
| 8. October | 0 | 0 | | |
| 9. October | 0 | 0 | | |
| 10. October | 0 | 0 | | |
| 11. October | 0 | 0 | | |
| 12. October | 0 | 0 | | |
| 13. October | 0 | 0 | | |
| 14. October | 0 | 0 | | |
| 15. October | 0 | 0 | | |
| 16. October | 0 | 0 | | |
| 17. October | 0 | 0 | | |
| 18. October | 0 | 0 | | |
| 19. October | 0 | 0 | | |
| 20. October | 0 | | | |
| 21. October | 0 | 0 | | |
| 22. October | 0 | 0 | | |
| 23. October | 3 | 3 | | |
| 24. October | 2 | 2 | | |
| 25. October | 3 | 2 | | 0 |
| 26. October | 10 | | 0 | 2 |
| 27. October | 8 | 11 | 3 | 1 |
| 28. October | 3 | 7 | 0 | 0 |
| 29. October | 0 | 0 | | |
| 30. October | 0 | 0 | | |
| 31. October | 0 | 0 | | |
|
| Dato | VL | BH | BL | SK |
| November | 1 | 2 | 0 | 0 |
| 1 November | 0 | 0 | | |
| 2 November | 0 | 0 | | |
| 3 November | 0 | 0 | | |
| 4 November | 0 | 0 | | |
| 5 November | 0 | 0 | | |
| 6 November | 0 | 0 | | |
| 7 November | 0 | 0 | | |
| 8 November | 0 | 0 | | |
| 9 November | 0 | 0 | | |
| 10 November | 0 | 0 | | |
| 11 November | 0 | 0 | | |
| 12 November | 0 | 0 | | |
| 13 November | 0 | 0 | | |
| 14 November | 0 | 0 | | |
| 15 November | 0 | 0 | | |
| 16 November | 0 | 0 | | |
| 17 November | 0 | 0 | | |
| 18 November | 0 | 0 | | |
| 19 November | 0 | 0 | | |
| 20 November | 0 | 0 | 0 | 0 |
| 21 November | 1 | 1 | 2 | 1 |
| 22 November | 1 | 1 | | |
| 23 November | 1 | 1 | | |
| 24 November | 1 | 1 | | |
| 25 November | - | 15 | | |
| 26 November | - | 5 | | |
| 27 November | - | 6 | | |
| 28 November | 4 | 8 | 4 | 1 |
| 29 November | 7 | 6 | 7 | 3 |
| 30 November | 7 | 9 | | 1 |
|
| Dato | VL | BH | BL | SK |
| December | 18 | 26 | 7 | 10 |
| 1 December | 7 | 11 | 10 | 5 |
| 2 December | 10 | 13 | 10 | 5 |
| 3 December | 8 | 12 | 10 | 5 |
| 4 December | 9 | 12 | 9 | 5 |
| 5 December | 17 | 16 | 11 | 6 |
| 6 December | 19 | 19 | 5 | 11 |
| 7 December | 26 | 29 | 0 | 12 |
| 8 December | 30 | 40 | 4 | 18 |
| 9 December | 29 | 39 | 1 | 18 |
| 10 December | 27 | 38 | 1 | 12 |
| 11 December | 22 | 38 | 6 | 8 |
| 12 December | 17 | 30 | 5 | 7 |
| 13 December | 17 | 25 | 3 | 7 |
| 14 December | 16 | 25 | 3 | 6 |
| 15 December | 16 | 24 | 3 | 6 |
| 16 December | 16 | 24 | 3 | |
| 17 December | 16 | 24 | 3 | |
| 18 December | 16 | 24 | 7 | |
| 19 December | 16 | 25 | 6 | 10 |
| 20 December | | 30 | 10 | 10 |
| 21 December | 17 | 29 | 10 | 10 |
| 22 December | 17 | 29 | 8 | 10 |
| 23 December | 17 | 29 | 8 | 10 |
| 24 December | 16 | 28 | 8 | 10 |
| 25 December | 16 | 28 | 8 | 10 |
| 26 December | 18 | 27 | 7 | 10 |
| 27 December | 17 | 28 | 7 | 10 |
| 28 December | 18 | 28 | 7 | 10 |
| 29 December | 17 | 35 | 7 | 12 |
| 30 December | 29 | 43 | 12 | 28 |
| 31 December | 27 | 44 | 15 | |
|
| Dato | VL | BH | BL | SK |
| January | 34 | 47 | 15 | 23 |
| 1 January | 30 | 43 | 17 | |
| 2 January | 29 | 41 | 13 | 26 |
| 3 January | 28 | 41 | 13 | 26 |
| 4 January | 27 | 40 | 13 | 26 |
| 5 January | 25 | 39 | 13 | |
| 6 January | 27 | 38 | 13 | 26 |
| 7 January | 26 | 39 | 12 | |
| 8 January | 26 | 38 | 12 | |
| 9 January | 26 | 38 | 12 | 19 |
| 10 January | 26 | 38 | 12 | 18 |
| 11 January | 25 | 33 | 8 | 13 |
| 12 January | 20 | 30 | 0 | 10 |
| 13 January | 20 | 29 | 0 | 10 |
| 14 January | 20 | 28 | | |
| 15 January | 20 | 27 | 0 | |
| 16 January | 19 | 26 | 0 | 9 |
| 17 January | 21 | 27 | 0 | 9 |
| 18 January | 22 | 33 | 9 | 11 |
| 19 January | 29 | | 9 | 15 |
| 20 January | 48 | 93 | 26 | 30 |
| 21 January | 63 | 121 | 35 | |
| 22 January | 60 | 109 | 33 | |
| 23 January | 55 | 97 | 29 | 38 |
| 24 January | 52 | 89 | 26 | 34 |
| 25 January | 50 | 64 | 23 | 32 |
| 26 January | 47 | | 23 | 32 |
| 27 January | 45 | | 22 | 32 |
| 28 January | 44 | | 21 | |
| 29 January | 43 | | 21 | |
| 30 January | 42 | | 20 | 29 |
| 31 January | 40 | 61 | 20 | 27 |
|
| Dato | VL | BH | BL | SK |
| februar | 77 | 84 | 42 | 48 |
| 1 February | 40 | 60 | 20 | 25 |
| 2 February | 39 | 59 | 20 | 25 |
| 3 February | 37 | 58 | 20 | 25 |
| 4 February | 38 | 57 | 19 | |
| 5 February | 42 | 57 | 25 | |
| 6 February | 56 | 75 | 40 | 45 |
| 7 February | 58 | 75 | 39 | 43 |
| 8 February | 60 | 80 | 42 | 46 |
| 9 February | 73 | 90 | 48 | 55 |
| 10 February | 72 | 88 | 46 | 53 |
| 11 February | 72 | 86 | 45 | |
| 12 February | 69 | 85 | 45 | |
| 13 February | 65 | | 45 | |
| 14 February | 64 | | 45 | 47 |
| 15 February | 67 | 80 | 43 | 47 |
| 16 February | 104 | 106 | 54 | 60 |
| 17 February | 112 | 106 | 60 | 68 |
| 18 February | 114 | 106 | | 65 |
| 19 February | 113 | 105 | 57 | 64 |
| 20 February | 108 | 104 | 57 | 64 |
| 21 February | 108 | 102 | 57 | |
| 22 February | 106 | 100 | 50 | 60 |
| 23 February | 99 | 96 | 48 | 55 |
| 24 February | 90 | 87 | 37 | 45 |
| 25 February | 86 | 84 | 37 | |
| 26 February | 84 | 83 | 35 | |
| 27 February | 82 | 82 | 35 | 42 |
| 28 February | 81 | 84 | 36 | 50 |
|
| Dato | VL | BH | BL | SK |
| mars | 109 | 100 | 47 | 60 |
| 1 March | 118 | 110 | 61 | 79 |
| 2 March | 122 | 121 | 60 | 89 |
| 3 March | 128 | 124 | 57 | 84 |
| 4 March | 125 | 123 | 55 | |
| 5 March | 122 | 118 | 54 | |
| 6 March | 118 | 114 | 52 | 75 |
| 7 March | 113 | 112 | 52 | 74 |
| 8 March | 114 | 109 | 52 | 69 |
| 9 March | 115 | 112 | 54 | 75 |
| 10 March | 116 | 111 | 54 | |
| 11 March | 114 | 109 | 53 | |
| 12 March | 108 | 106 | 53 | |
| 13 March | 110 | 104 | 50 | 68 |
| 14 March | 108 | 103 | 50 | 66 |
| 15 March | 109 | 104 | 50 | 66 |
| 16 March | 107 | 104 | 49 | 65 |
| 17 March | 104 | 100 | 47 | 64 |
| 18 March | 106 | 96 | | |
| 19 March | 106 | 95 | 46 | |
| 20 March | 104 | 94 | 44 | |
| 21 March | 103 | 92 | 44 | 60 |
| 22 March | 102 | 91 | 44 | 60 |
| 23 March | 102 | 91 | 44 | 60 |
| 24 March | 101 | 91 | 44 | 60 |
| 25 March | 100 | 91 | | |
| 26 March | 99 | 90 | 43 | |
| 27 March | 97 | 92 | 42 | 61 |
| 28 March | 108 | 97 | 46 | 59 |
| 29 March | 104 | 95 | 42 | |
| 30 March | 99 | 90 | 40 | 48 |
| 31 March | 92 | 88 | 32 | 48 |
|
| Dato | VL | BH | BL | SK |
| april | 72 | 70 | 9 | 21 |
| 1 April | 90 | 87 | 32 | |
| 2 April | 91 | 86 | 29 | |
| 3 April | 93 | 84 | 26 | 50 |
| 4 April | 89 | 82 | 23 | 48 |
| 5 April | 87 | | 23 | 48 |
| 6 April | 87 | 80 | 21 | |
| 7 April | 88 | 81 | 21 | 46 |
| 8 April | 87 | | 18 | |
| 9 April | 93 | 95 | 18 | |
| 10 April | 89 | 90 | 11 | |
| 11 April | 87 | 84 | 11 | 42 |
| 12 April | 87 | 87 | 10 | 42 |
| 13 April | 87 | | 8 | |
| 14 April | 85 | 85 | 6 | |
| 15 April | 82 | 82 | 0 | |
| 16 April | 79 | 79 | 0 | |
| 17 April | 77 | 76 | 0 | |
| 18 April | 74 | 73 | 0 | 25 |
| 19 April | 71 | | 0 | 0 |
| 20 April | 68 | 68 | 0 | 0 |
| 21 April | 66 | 65 | 0 | 0 |
| 22 April | 64 | 63 | 0 | |
| 23 April | 58 | 56 | 0 | |
| 24 April | 55 | 51 | 0 | 0 |
| 25 April | 49 | 47 | 0 | 0 |
| 26 April | 46 | 43 | 0 | 0 |
| 27 April | 41 | 37 | 0 | 0 |
| 28 April | 38 | 33 | 0 | 0 |
| 29 April | 35 | 30 | 0 | |
| 30 April | 29 | 25 | 0 | |
|
| Dato | VL | BH | BL | SK |
| mai | 2 | 2 | 0 | 0 |
| 1 May | 25 | 21 | 0 | |
| 2 May | 20 | 19 | 0 | |
| 3 May | 17 | 18 | 0 | |
| 4 May | 8 | 13 | 0 | |
| 5 May | 0 | 0 | 0 | |
| 6 May | 0 | 0 | 0 | |
| 7 May | 0 | 0 | 0 | |
| 8 May | 0 | 0 | 0 | |
|
|
|
steinar@latinitas.org (Steinar Midtskogen).